
A Missing Data on Covid-19 Forecasts
Abstract
Mathematical and computational studies of Covid-19 have underestimated the influence that other countries have on their daily records. To visualize this, a Granger causality analysis was implemented in Python to determine if the cases registered in Brazil, Chile, Colombia, Ecuador, Panama, Paraguay, Peru and the USA have any effect on Venezuela, and between all of them. Finally, this paper highlights the need to incorporate causality analysis employing only the cases of Covid-19 to improve mid and long term forecasts.
Author Contributions
Academic Editor: Sudipti Gupta, Ohio.
Checked for plagiarism: Yes
Review by: Single-blind
Copyright © 2021 Raúl Isea
 This is an open-access article distributed under the terms of the Creative Commons Attribution License, which permits unrestricted use, distribution, and reproduction in any medium, provided the original author and source are credited.
Competing interests
The authors have declared that no competing interests exist.
Citation:
Introduction
It was shown in December 2020 that no continent escaped the Covid-19 pandemic after 36 cases were detected in the Chilean research base in Antarctica 1. This example shows the need to consider the influence of other countries on the apparition of punctual outbreaks in a given country despite its prevention measures in the studies of epidemics by Covid-19.
Let us remember that the first outbreaks of Covid-19 occurred in the city of Wuhan, China on December 2019, and in less than three months a pandemic was declared (on March 11, 2020), showing the permeability of the borders of all countries. As of June 2021, it has spread in more than 210 countries, with more than one hundred ninety-four million cases and four million deceased around the world, according to the Johns Hopkins University.
Currently there are various computer programs capable of detecting causality, such as WhyNot 2, CausalML 3, CDT 4, DoubleML 5, Tetrad 6, to cite some examples. Many of them are based on the Granger causality model 7, 8. In this paper, we developed a code to calculate Granger causality based on the methodology described in 8, 9, 10, and we can determine the possible influence (ie., Granger causality) between countries. It should be borne in mind that this methodology has been widely used and validated in neuroscience 11, economics 12, climatology 13 and political analysis 14, and so on. In the next section we describe the methodology used in this paper.
Methodology
In this first study, we employed all the daily cases registered in Venezuela and eight other countries in America which are Brazil, Chile, Colombia, Ecuador, Panama, Paraguay, Peru and the USA, according to the records obtained from at Johns Hopkins Coronavirus Resource Center available at coronavirus.jhu.edu.
Since the Granger causality studies require stationary data series, it was necessary to normalize the data for each country, determining the differences based on the frequency of occurrence. Kwiatkowski et al 15 explained how to perform the test the stationary with the help of unit root test. In order to accomplish this, we performed the unit root tests that allow us to validate them, such as Augmented Dickey Fuller 16, Kwiatkowski-Philips-Schimidt-Shin 15, and Philips-Perron 17. In parallel, we employed cointegration studies and Error Correction Model 18 based on the Johansen Fisher test 19. These technical details will be explained in another journal specialized in computational statistics.
Finally, we consider as an example the cases in Venezuela. Its first cases were detected in March 2020, and three days later, this country implemented quarantines in between states, schools and public transportation were suspended. Venezuela has always had its borders open for the return of Venezuelans from Ecuador, Peru and Chile (mainly) who had to cross the border countries (most often Colombia). On the other hand, it was identified that the epidemic outbreak that triggered the cases in that country was the outbreak that occurred in El Mercado de Las Pulgas (near the border with Colombia) 20, and of course, this country presents also various variants that have been detected from other parts of the world.
Results
The data obtained for this paper from the Johns Hopkins University cover the period between March 15, 2020 and June 20, 2021, giving a total of 533 records for each of the nine countries chosen for this paper. As indicated in the previous section, we validated all data according to statistical tests of unit roots, as shown in the figure 1. In fact, this figure shows the result in four randomly selected countries when we plot y(t) versus y(t+1), that is, for Brazil , Peru , USA and Venezuela, and really is stationary.
Figure 1.Lag plot the cases of Covid-19 with itself (see text for more details)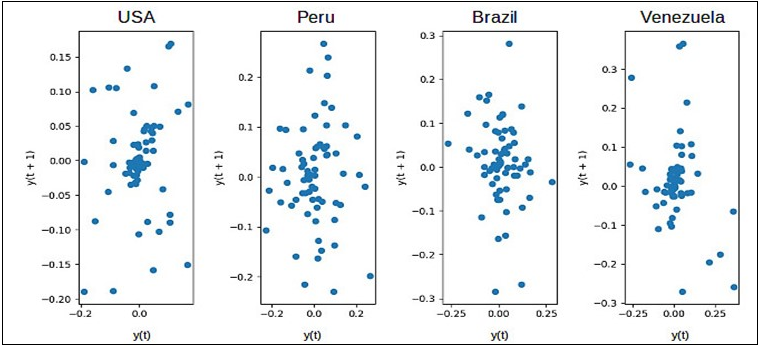
The results of Granger causality are shown in Table 1. This table shows that all the countries impact (i.e. Granger causality) in the cases of the other countries. For example, Brazil and Colombia influence the cases registered in Venezuela, and Venezuela also does it in Colombia. For this reason, we can see that between Venezuela and Colombia there is bidirectional causality; while with Brazil it is unidirectional (Brazil only influences the cases of Venezuela, but not vice versa).
On the other hand, Table 1 shows that other countries that do not share border with a given country also influence it. Going back to the Venezuela example again, Chile, Panama, Paraguay and Peru also impact in this country, which reflects an existing dynamic with these countries.
Table 1. Results of the Granger causality of the selected countries in this study.| Brazil | Chile | Colombia |
| Granger causality to | Granger causality to | Granger causality to |
| Chile (0.0041) | Ecuador (<10-5) | Paraguay (<10-5) |
| Panama (<10-5) | Venezuela (0.0096) | Venezuela (0.012) |
| Peru (0.0242) | ||
| USA (<10-5) | ||
| Venezuela (0.0002) | ||
| Ecuador | Panama | Paraguay |
| Granger causality to | Granger causality to | Granger causality to |
| Chile (0.0001) | Colombia (<10-5) | Colombia (0.0023) |
| Paraguay (0.0091) | Paraguay (0.0322) | Panama (0.0080) |
| Peru (0.0027) | Peru (0.0264) | Peru (0.0092) |
| Venezuela (0.0016) | USA (<10-5) | USA (0.0140) |
| Venezuela (<10-5) | ||
| Peru | USA | Venezuela |
| Granger causality to | Granger causality to | Granger causality to |
| Chile (0.0011) | Colombia (0.0119) | Brazil (<10-5) |
| Colombia (0.0152) | Panama (<10-5) | Colombia (0.0441) |
| Paraguay (0.0408) | Paraguay (<10-5) | Paraguay (0.0030) |
| USA (0.0160) | Peru (0.0067) | |
| Venezuela (0.0024) |
It is interesting to highlight the USA also influence the aforementioned countries. Perhaps the influence in Panama and Colombia was to be expected, but it also affects the cases detected in Peru and Paraguay. This result should be studied in more detail in future works.
Finally, and as a curious fact, it is possible to raise the possibility that the cases of Venezuela can be described in terms of two countries that we have seen that influence it (Colombia and Peru), as can be seen in figure 2. This calculation was obtained by least squares considering a linear relationship, obtaining:
Venezuela cases (t) = -953.59 + 0.078 * Peru cases (t) + 0.042 * Colombia cases (t).
where t is the unit of time. In fact, despite the simplicity of the calculation, the adjustment (R2) is higher than 89%. Although it is very daring to infer this without other studies, it allows us to visualize the advantage of being able to explain the outbreaks that occurred in certain countries.
Figure 2.The results of predicting (orange continuous line) with respect to the cases registered in Venezuela (blue), considering only the influence of Colombia and Peru (see details in the text).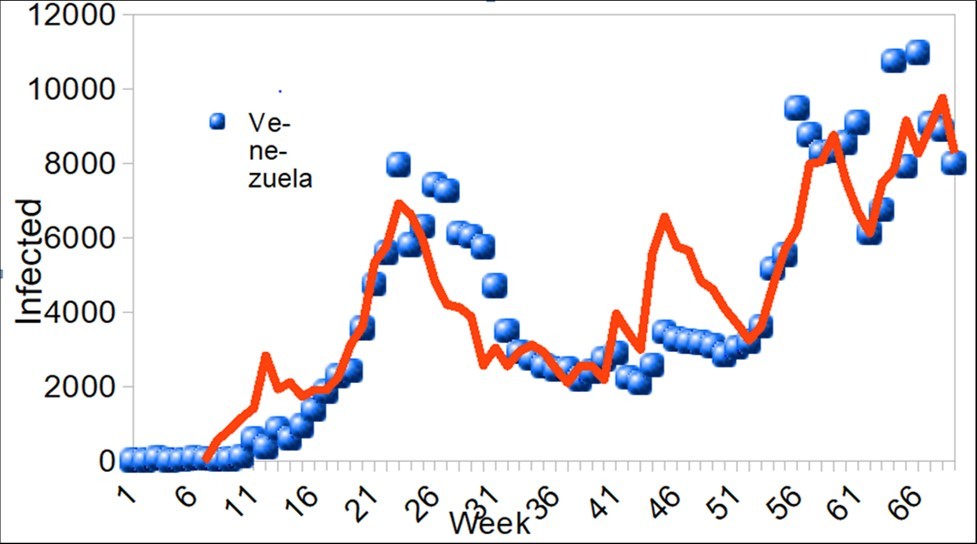
Conclusions
Mathematical models proposed thus far consider only the inner cases of a country and rarely take into account the possible influence of other countries. As can be seen in this work, these are effectively playing a role in the contagion dynamics between countries, and it is necessary to develop new methodologies that allow us to validate the results presented in this work.
Acknowledgment
I’d like to acknowledgment to Jesus Isea for your comments and help in this manuscript.
References
- 8.Kirchgässner G, Wolters J, Hassler U. (2013) In: Introduction to modern time series analysis. Springer texts in Business and Economics. , Berlin, Heidelberg
- 9.Wiedermann W, A von Eye. (2016) In Statistics and Causality: methods for applied empirical research . Wiley series in Probability and Statistics.