
The Impact of Public Financing, Economic Growth, and Corruption on Immunization Performance: Evidence from 37 Sub-Saharan African Countries
Abstract
Background
In sub-Saharan Africa, where many countries continue to experience high burdens of vaccine-preventable diseases, increasing immunization access have been a priority for the governments and international organizations such as Gavi, the Vaccine Alliance. Over 40 Gavi-supported African countries have been impacted, with 364 million children reached and over US$5.7 billion disbursed, averting over 8.9 million child deaths. Despite this progress, the African region has struggled with immunization coverage due to various factors. Nevertheless, some African countries are transitioning out of Gavi support due to economic growth. However, many require strong political will to increase their expenditure on immunization. This study therefore aims to understand the factors influencing immunization performance and its relationship to public expenditure.
Methods
Data on 37 Gavi-eligible sub-Saharan African countries between 2006 and 2019 was obtained from the World Bank’s World Development Indicators, the WHO and UNICEF Joint Reporting Form and the Transparency International’s Corruption Perception Index. Descriptive immunization and health expenditure were analyzed using a panel regression of variables. DPT3 was used as an indicator of immunization uptake. The indicator for public expenditure on immunization per child was based on government spending on immunization divided by the number of children in the birth cohort.
Results
The average gross national income increased from US$639 to US$1,192 per capita, while government spending on immunization increased from US$1.7 to about US$4.5 per child. The findings show that there is a correlation between improved immunization financing, increased gross national income, reduced corruption, and improved immunization coverage. However, performance declines beyond a certain threshold when gross national income per capita increases. In addition, an English-speaking country effect was observed.
Conclusions
While improved immunization financing increases immunization coverage and constitutes an advocacy talking point, there is a need to understand why an increase in gross national income per capita does not translate into an improved immunization coverage.
Key highlights
Increasing national spending on immunization drives up the uptake of childhood vaccines.
There is a threshold beyond which immunization coverage falls despite increased GNI.
Controlling corruption increases immunization coverage tendency.
French- and English-speaking countries’ immunization coverage differs.
Immunization and health system financing have separate outcomes.
Article Information
- Received
- Accepted
- Published
Academic Editor: Ian James Martins, Edith Cowan University.
Checked for plagiarism: Yes
Review by: Single-blind
Copyright © 2025 Alain Komi Ahawo, et al
 This is an open-access article distributed under the terms of the Creative Commons Attribution License, which permits unrestricted use, distribution, and reproduction in any medium, provided the original author and source are credited.
Corresponding author: Gbadebo Collins Adeyanju, Center for Empirical Research in Economics and Behavioral Science (CEREB) University of Erfurt, Erfurt, Germany —
Competing Interests
The authors declared that they have no competing interest.
Funding
Not applicable
Data Availability
The datasets used and/or analyzed during the current study are available from the corresponding author on reasonable request.
Citation:
Introduction
Immunization is a vital public health intervention that has saved countless lives by preventing and controlling the spread of infectious diseases 1. It is a global health and development success story, owing to millions of lives saved every year, by reducing the risk of preventable diseases and building the body’s natural defenses 2. Vaccines against preventable disease can now prevent over 20 life-threatening diseases, thereby contributing to lowering the burden of morbidity and mortality associated with vaccine-preventable diseases (VPDs) by 3.5-5 million deaths every year 3. To this end, children and vulnerable groups of all ages are now living longer and healthier lives thanks to the efficacy of vaccines 3, 4. This is why the World Health Organization (WHO) considers vaccination to be a key component of universal healthcare and a fundamental human right.
In sub-Saharan Africa (SSA), where many countries continue to face high burdens of vaccine-preventable diseases, immunization programs have been a priority for both the governments and international organizations such as the World Health Organization (WHO), Gavi, the Vaccine Alliance, the Agence de Medicine Preventive (AMP) and others. Gavi has played a particularly instrumental role in many of the milestones achieved in the SSA by providing support to eligible countries to strengthen their immunization systems and increase access to vaccines, with a particular focus on low-income countries. Since its inception, Gavi has collaborated with over 40 African countries, leading to the introduction of nine new vaccines into the national routine immunization (RI) schedules, reaching 364 million children and disbursing over US$5.7 billion to Gavi-supported African countries. This has helped avert over 8.9 million child deaths 5, 6. In addition to childhood immunization, intervention for adolescents have also been implemented. Gavi has supported over 13 SSA countries to introduce the Human Papillomavirus (HPV) vaccine, which is the primary cause of cervical cancer, and around 6 million adolescent girls between aged 9-15 in Africa were vaccinated against HPV in 2020 6.
Despite the progress made in expanding access to vaccines, challenges still remain in ensuring equitable and sustainable coverage. The SSA region has struggled to achieve and maintain high levels of immunization coverage due to various factors, including weak health systems, vaccine hesitancy, limited resources, political instability and other as yet undetermined reasons 7, 8. These challenges can be better understood by conspiring the experience of under-vaccinated and zero-dose children.
While the number of under-vaccinated children (those who have not received all three doses of the Diphtheria Tetanus and Pertussis (DTP3) vaccine) has decreased globally from about 22 to 20 million between 2010 and 2019 respectively, the geographical distribution of where these children reside has equally evolved, as shown in Figure 1 below 9, 10. The percentage of children under-vaccinated for DTP3 globally has increased from 25% to 32% in West and Central Africa, while in almost every other region it has either remained stagnant or decreased; for instance, in South Asia it dropped from 38% to 20% 10, 11, 12. Similarly, the number of children with zero-doses (those who have not received the first DTP dose) has barely decreased from 15 to around 14 million between 2010 and 2019. However, nearly two-third of the countries contributing to the zero-dose figure are concentrated in ten countries, four of which in SSA (Angola, Ethiopia, the DRC Congo and Nigeria), yet these countries carry the highest burden 7, 13, 14, 15. It is pertinent to ask why the SSA region has not improved significantly in terms of immunization coverage, despite an increase in public expenditure on immunization in the region. Although expenditure on vaccination does not necessarily predict coverage of basic vaccines compared to expenditure on health 16. However, as assessment of immunization financing provides further arguments for increasing the state’s budgetary provision, with all other variables remaining constant.
Figure 1. Global share of under-vaccinated children for DTP3 (2010 – 2019). (10,13)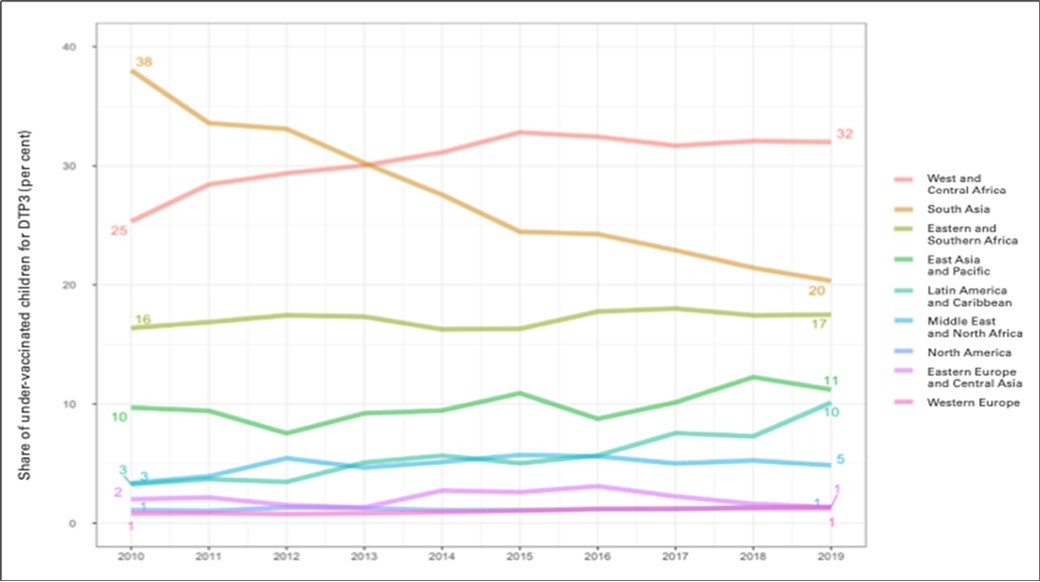
Download figure
Data shows that, globally, the cost of immunizing each surviving infant is US$68, equivalent to US$1.30 per capita, and represents 0.02% and 0.3% of the global Gross Domestic Product (GDP) and current health expenditure, respectively 17, 18. The weight of the financial burden of immunization varies between the low- and middle-income countries (LMICs) and the Western, Educated, Industrialized, Rich and Democratic (WEIRD) or High-Income Countries (HICs) 19, 20, 21. The WEIRD countries spend more on immunization per capita and their government fund a larger proportion of the total immunization expenditure 19, 22. Therefore, it is assumed that the disparity in coverage between HICs/WEIRD countries and LMICs is a result of state spending on immunization.
However, the relationship between immunization spending and immunization coverage has not been found to be directly linked. Nevertheless, it is worth exploring further, given that even countries in the same World Bank economic grouping have different immunization outcomes or coverages. For example, both Burkina Faso and Guinea (Gavi low-income countries) spend about US$35 on immunization per surviving infant 21, 22, 23. However, while Burkina Faso has maintained a rate of unvaccinated and under-vaccinated children below 10%, even after introducing additional vaccines such as the second measles dose, the pneumococcal conjugate vaccine, the rubella vaccine and the rotavirus vaccine, Guinea’s the rate of unvaccinated and under-vaccinated children exceeds 50% 17, 20, 21. This scenario is not limited to low-income countries. It can also be seen in middle- and high-income countries.
Although studies on factors influencing vaccination coverage in SSA are abundant, few examine the extent to which immunization performance is related to the state’s public expenditure on immunization. Therefore, this study aims to analyze the factors affecting the performance of the immunization program in 37 Gavi-eligible countries in SSA, with a particular focus on the relationship between public expenditure on immunization and immunization coverage.
A direct relationship between immunization financing and immunization coverage would be a critical game changer, given that countries are transitioning out of Gavi funding for immunization and there has been long-standing advocacy for increased budgetary allocation by SSA countries. Some countries achieve much higher coverage with the same investment, while others invest considerably more but do not immunize a greater percentage of their population. A correlation or lack of it between these two dynamics and other secondary variables would strengthen the evidence based for policy action. By identifying the factors that influence the performance of the immunization program in Gavi-eligible SSA countries, this study will enhance the evidence based for policies and strategies that can improve immunization coverage and ultimately contribute to reducing VPD and deaths in SSA.
Methodology
Data source
The study used data of 37 Gavi-eligible SSA countries for the period 2006-2019, with the exception of Somalia and South Sudan (due to incomplete data). Data from the World Bank’s World Development Indicators and the WHO/UNICEF Joint Reporting Form (JRF), especially the Comprehensive Multi-Year Plan (cMYP) data, were used in the study. Transparency international’s corruption perception index data was also used.
Data analysis
Data from the JRF database was used to examine immunization coverage, with DPT3 serving as an indicator of immunization uptake and a measure of dependent variable in the respective countries. The indicator for public expenditure on routine immunization per child (the independent variable or predictor) was based on total government spending on immunization (i.e., vaccine and operational costs) divided by the number of children in the birth cohort. This predictor was extracted from World Bank data, which essentially comprises a country’s Gross National Income (GNI), government expenditure per child on routine immunization and the annual economic benefits of immunization coverage, among other things 24.
Panel regression was used to analyze the data. This analytical framework is an appropriate tool for controlling the dependence of unobserved independent variables on a dependent variable 25, 26. The panel data constructed in the context of this study is non-cylindrical due to the availability of certain countries at certain dates. Panel data helps to deal with omitted variable bias due to heterogeneity in the datasets by controlling for variables that cannot be observed or measured yet correlate with the predictors 27, 28.
Analytical Model
The theoretical panel model can be written for N countries (i = 1,...,N) and T time observations (t = 1,...,T), i.e. n = N × T total observations, as follows:
y_it = a_0i +〖a^'〗_i x_it + ε_it (*)
Where:
y_it = endogenous variable observed for individual i in period t.
x_it = vector of k exogenous variables.
a_0i = constant term for individual i.
a_i = vector of the k coefficients of the k exogenous variables.
ε_it = error term.
Empirically, the model we estimate in this work is written:
DCV_it = α_i + β_1 ln (GNIC_it ) + β_2 〖(ln〗〖(GNI〖CS〗_it )) 〗+ β_3〖Gov_expRIchd_it〗+ β_4 CPI_it + β_5 AA + αi + τt + εit
Where:
DCV_it represents the DTP3 vaccination coverage of country i at time t.
αi represents the country-specific effect;
τt: time effect variable to account for omitted time-varying variables and stochastic shocks common to all countries; and
i: is the individual dimension representing countries and t, the time dimension.
The study tested the robustness of the estimates upon two types of panel data regression. That is, estimates from fixed effects and random effects regressions. To determine the best fit model within this framework, the Hausman test was employed to distinguish between the two specified models 29. We also specify a semi-parametric partially linear fixed effects model presented by:
DCV_it = α_i + m(ln(GNIC_it ))
Where
m (.) is an unknown smooth function that we seek to estimate, depending only on GNI per capita, while the other variables are parametrically specified.
The previous equation was estimated using the Baltagi and Li methods 25. This technique involves first estimating the parameters of the parametrically specified variables in the model. These parameters then allow the curve m(.) to be estimated in a second step using the kernel or spline regression method 30, 31. This method was used to determine the relationship between DPT3 vaccination coverage and GNI per capita, as well as the other factors that the study attempts to assess, including the GNI per capita, the corruption perception index (CPI), Anglophone versus Francophone Gavi-supported African countries, and government immunization expenditure per child.
Results
The descriptive statistics (Table 1) and the correlation matrix (Table 2) provided interesting insights into the relationship between the study variables. They provided significant explanations that enabled the study outcomes to be determined. The outcome and code variables included GNI per capita (InGNIpercapAtlas), GNI per capita squared (InGNIquare), corruption perception index (CPI), membership of the English-speaking zone (I.AA), and government expenditure on immunization per child (Gov_expRIchd). Basic vaccination coverage among the 37 assessed countries increased by 6% over about two decades (2006-2019), as did GNI per capita and government expenditure on immunization per child, which increased significantly by around 200% between 2006 and 2019. Similarly, the countries’ official government corruption perception score improved significantly during this period, rising from 25% to 30%.
Table 1. Descriptive statistics for model variables| Variable | 2006 | 2019 | Mean | Std. Dev. | Min | Max |
|---|---|---|---|---|---|---|
| DTP3Coverage | 72.1842 | 78.421 | 76.387 | 17.672 | 19 | 99 |
| lnGNIpercapAtlas | 6.290 | 6.905 | 6.729 | .631 | 5.011 | 8.519 |
| lnGNIquare | 39.916 | 48.042 | 45.682 | 8.563 | 25.106 | 72.577 |
| Gov_expRIchd | 1.789 | 4.326 | 3.091 | 3.038 | 0 | 26.129 |
| CPI | 24.818 | 30.132 | 27.804 | 8.607 | 1.5 | 56 |
| GNIpercapAtlas | 606.316 | 1160.526 |
Public Expenditure on Routine Immunization (RI)
Immunization expenditure per child has constantly evolved from 2006 to 2019 (see Figure 2), rising from US$1.7 to US$4.5. This significant growth indicates a certain willingness or commitment to financing immunization, with the amount doubling per child over the last two decades.
Figure 2. Government expenditure in routine immunization per child 2006-2019 Gavi eligible countries in Africa (21). 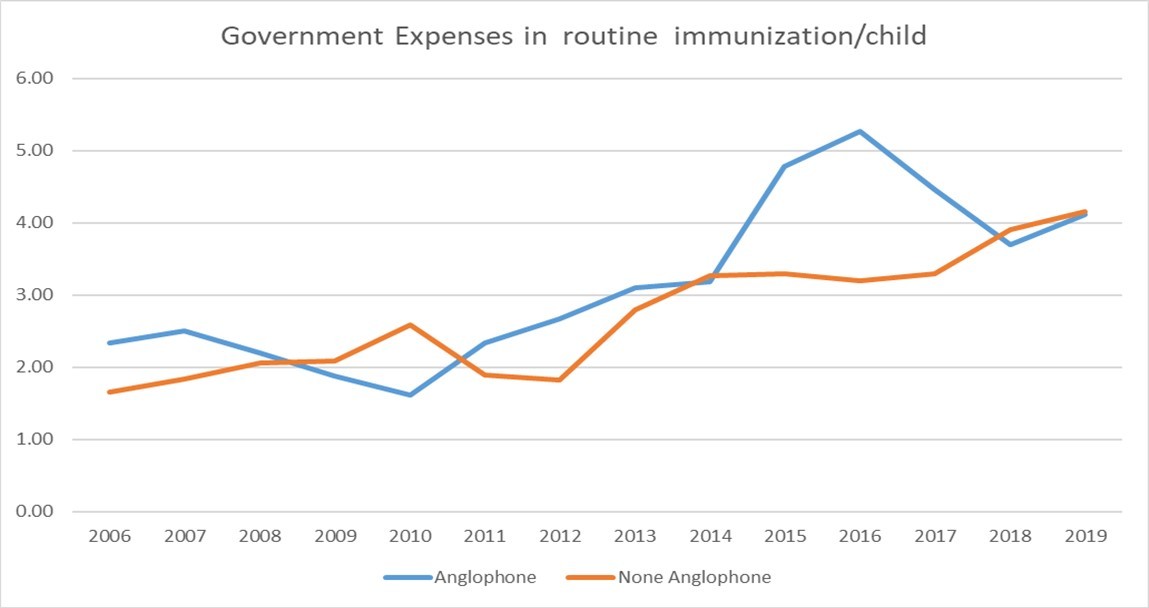
Download figure
Public Expenditure on Healthcare Services
In contrast to immunization financing, the percentage of health expenditure (see Figure 3) within the understudy timeframe shows a negative trend compared to the former. That is, vaccination coverage vis-à-vis health expenditure shows stagnation or even a regression, especially in Gavi-supported Francophone or non-Anglophone African countries. The analysis demonstrated very clearly that Anglophone (English-speaking) countries tend to allocate a higher proportion of their national fiscal policy towards to health expenditure than Francophone (French-speaking) countries.
Figure 3. Health expenditure % total expenditure: 2006-2019 Gavi eligible countries in Africa (21).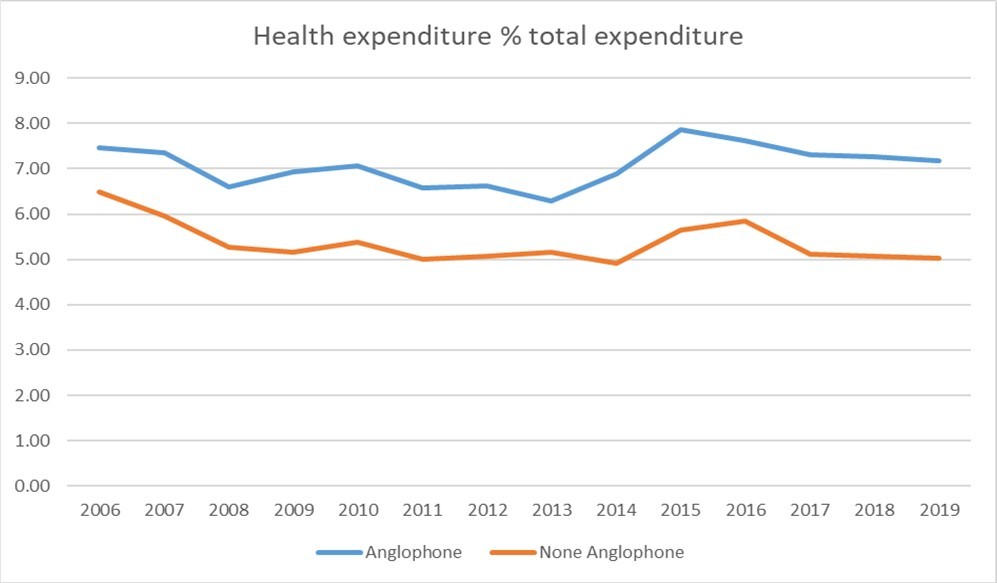
Download figure
Correlations for Influencers of Immunization Coverage
The correlation table (Table 2) below shows the relationships between the different dependent and independent variables assessed in this study. Focusing on the primary outcome or dependent variable of the model reveals a significant link between the latter and the other variables. Vaccination coverage against other predictors shows that, immunization coverage declined within the period under study, in relation to GNI per capita and its square. Conversely, an increase in immunization coverage was observed when compared to the country’s corruption perception index and immunization expenditure per child.
Table 2. Pairwise correlations| Variables | (1) | (2) | (3) | (4) | (5) |
|---|---|---|---|---|---|
| (1) DTP3Coverage | 1.000 | ||||
| (2) lnGNIpercapAtlas | -0.092* | 1.000 | |||
| (3) lnGNIquare | -0.096* | 0.998* | 1.000 | ||
| (4) Gov_expRIchd | 0.073* | 0.430* | 0.442* | 1.000 | |
| (5) CPI | 0.392* | 0.137* | 0.125* | 0.197* | 1.000 |
Multivariate model
The model evaluated the improvement in immunization coverage using the natural logarithm of the GNI per capita and its square, as well as immunization expenditure per child, membership of the English-speaking zone and the perception index of corruption (Table 3). The Hausmann test was then employed to determine whether the observed effect was fixed (FE) or random (RE).
Table 3. Panel Data model of immunization coverage| (1) | (2) | |
| VARIABLES | FE | RE |
| lnGNIpercapAtlas | 10.49 | 12.56 |
| (13.49) | (13.33) | |
| lnGNIquare | -0.485 | -0.725 |
| (1.017) | (1.002) | |
| Gov_expRIchd | 0.247* | 0.277** |
| (0.127) | (0.127) | |
| CPI | 0.116 | 0.168** |
| (0.0722) | (0.0705) | |
| 1.AA | - | 13.93*** |
| (5.035) | ||
| Constant | 23.78 | 13.66 |
| (44.79) | (44.37) | |
| Observations | 488 | 488 |
| R-squared | 0.66 | |
| Number of Id | 37 | 37 |
| Hausman Test | Chi-Stat = 8.60 | P-value = 0.134 |
For every 1% increase in GNI, immunization coverage increased by 10.49%. Controlling corruption and increasing in expenditure per child on immunization tend to significantly increase coverage. An English-speaking country effect significantly influences immunization coverage and should be investigated further to establish whether the findings can be replicated in French-speaking countries. The Hausman test indicates that the effect is related to chance.
Evolution of GNI and Vaccination Coverage
The GNI per capita more than doubled within the 2006-2019 period in the countries eligible for Gavi funding in SSA (see Figure 4). Parametric regression on panel data using random effects showed the trend of the threshold relationship, but the coefficients were not significant. Therefore, the study resorted to semi-parametric modelling to test the existence of the threshold.
Figure 4. Trend of the Threshold Relationship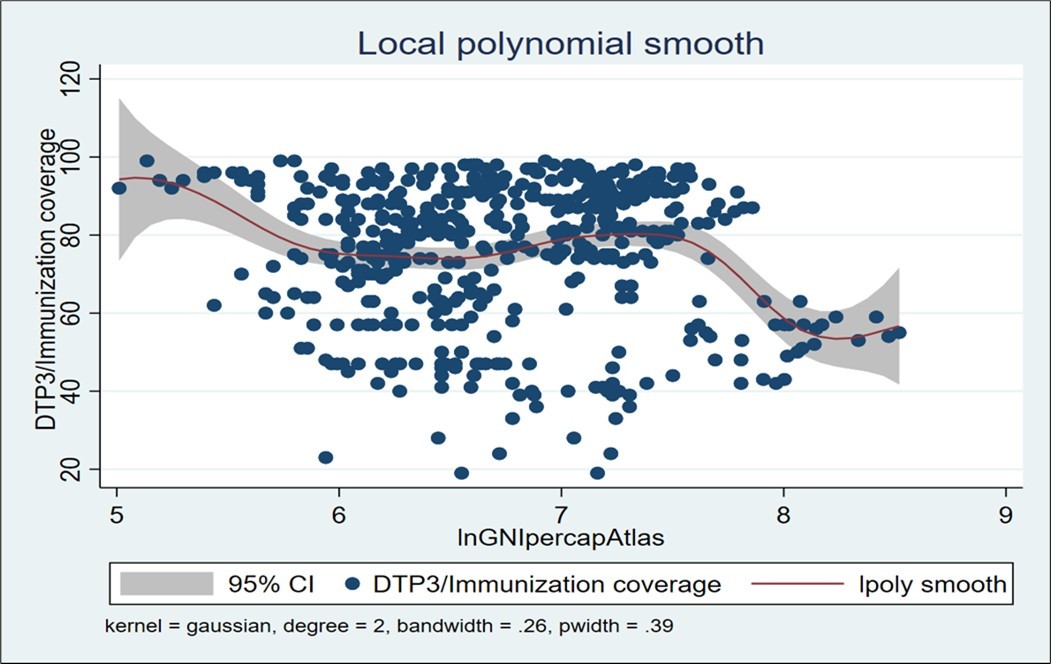
Download figure
Discussions
This study produced a wealth of new insights relating to the primary objective of understanding the factors influencing the performance of immunization programs and their relationship with public expenditure in the 37 Gavi-eligible countries in SSA. The average GNI of Gavi-eligible SSA countries increased from US$639 to US$1,192 per capita, while government spending on immunization, excluding external financing, increased from US$1.7 to US$4.5 per child. The results of the study also confirm a strong correlation between reduced corruption, improved immunization financing, increased GNI and improved immunization coverage in Gavi-eligible SSA countries. However, performance declines beyond a threshold increase in the GNI. This poses a challenge to maintaining achievements in Gavi transition countries.
The study demonstrates that there is a positive correlation between immunization coverage and financing, though this is not necessarily the case for health sector financing in general. Remarkably, for 1% increase in GNI, there was a staggering 10.49% increase in immunization coverage. The study outcomes also align with existing evidence that, where GNI increases, the priority in the allocation of health sector funding tends to shift from primary healthcare to hospital spending 32, 33, 34, 35, 36, 37. This is because a fall in immunization coverage is confirmed above a certain wealth threshold as the country’s GNI increases. However, it was unable to prove that, despite an upward trend in GNI, countries were able to spend US$60 per child per year to cover immunization needs. This situation could be exacerbated by the economic contraction following the COVID pandemic, which reduces the availability of funds in developing countries for finance health expenditure in general, and for immunization expenditure in particular. This is particularly pertinent given that the pandemic itself has put significant stain on health systems.
The effect demonstrated by Anglophone (English-speaking) SSA countries, which experienced a clear improvement in immunization coverage compared to the Francophone (French-speaking) SSA countries, requires the attention of country-level policymakers and global/regional health governance. Lessons learnt from the English-speaking countries could have a contagious effect, if positive elements are transposed to improve immunization coverage in French-speaking countries.
In Francophone Africa, the introduction of Human Papillomavirus (HPV) vaccine, which prevents cervical cancer, is progressing very slowly, with coverage lagging significantly behind that of Anglophone countries 38, 39, 40. Of the 15 countries in the Economic Community of West African States (ECOWAS), 11 are French-speaking, yet only four of these, namely Burkina Faso, Côte d'Ivoire, Cameroon, and Senegal have introduced the HPV vaccine into their National Immunization Programs (NIPs) 41, 42, 43. This situation underscores a considerable disparity within the region, and given the analysis of public expenditure for immunization, these outcomes are not surprising. As observed for specific vaccines such as HPV, this situation is widespread for all vaccines. Hence, there is a need to strengthen communication, awareness, community engagement and cultural acceptance, as well as political commitment and, most importantly, improved financial resource allocation.
It is commendable that the GNI per capita has steadily increased in the countries eligible for Gavi funding in SSA, reaching twice its initial value during the study period. Similarly, such growth could also be observed in the evolution of immunization expenditure per child, which rose from US$1.7 to US$4.5 between 2006-2019. This significant growth demonstrates a substantial increase in willingness and behavioral change with regards to financing immunization, to the extent that the amount has been more than doubled per child within the last two decades. However, as Figure 3 shows, there is likely a threshold beyond which coverage tends to fall despite the increase in GNI. Although, the parametric regression on panel data confirmed a trend of the threshold relationship, however, the coefficient has no significant value. As GNI is crucial in determining eligibility for Gavi funding, the negative influence of its evolution on immunization coverage deserves particular attention to ensure the sustainability of gains during the support period. Therefore, significant observation and action are needed to understand the decline in immunization coverage syndrome after certain GNI thresholds.
When assessed predictors are used to determine the primary determinant or dependent variable, the measure of immunization coverage shows that coverage drops within the period under study in relation to GNI per capita and its square. However, the opposite was observed in relation to whether or not the country is perceived to be corrupt and expenditure on immunization per child. This means that, on average, whenever GNI increases, immunization coverage decreases and vice versa. However, government spending on immunization per capita and the perception of corruption in countries have a positive effect on vaccination uptake. This is an important talking point for advocacy among state actors to increase fiscal responsibility towards immunization. Furthermore, the disparity between GNI per capita and immunization coverage seems to be an anomaly that requires much closer exploratory research. However, improved GNI per capita alone does not guarantee better immunization coverage when other barriers such as vaccine hesitancy, literacy and communication issues, misinformation, trust in vaccines and the healthcare systems, masculinity and gender disparity bias, cultural and religious practices, wealth disparity within countries, inadequate or poorly trained healthcare personnel, and so on remain constant, particularly in SSA 44, 45, 46, 47, 48, 49, 50. I.e., improved population’s economic wellbeing alone does not mitigate the socio-economic, psychological, socio-cultural and behavioral constraints that affect immunization coverage. However, a better understanding of this association in the SSA context would help state and non-state actors to develop more effective intervention strategies and adaptable plans for programs that promote immunization coverage.
In other low income and middle income (LMICs), e.g., the English- and Dutch-speaking Caribbean subregions of the Americas, where political will and government expenditure on immunization have been particularly strong, alongside factors such as dedicated healthcare workers (HCWs) and quality surveillance, resulting in the eradication of wild polio for 34 years, measles for 25 years, CRS for 17 years, and rubella for 15 years, immunization coverage has been remarkably positive 51, 52. Strong political will tends to manifest in financial, policy, and legislative support, and this combination is essential for systems fulfil their mandates.
Another notable finding of the study is the reaction of immunization coverage vis-à-vis public expenditure on immunization and health system in general. In contrast to the countries’ immunization financing, the percentage of expenditure on health shows a negative trend compared to the former. That is, although this was not the primary outcome of the study, the relationship between vaccination coverage and health expenditure shows stagnation or even retrogression, particularly in Gavi-eligible French-speaking SSA countries. It was clear that English-speaking Gavi-eligible SSA countries allocated a higher percentage of government expenditures to immunization needs consequently achieved positive immunization outcomes. Similarly, French-speaking Gavi-eligible SSA countries allocate a lower proportion of their public spending to immunization costs, resulting in the corresponding negative immunization coverage reported.
The study had some classic limitations relating to the completeness of the data on Gavi-eligible SSA countries, especially the omission of Somalia and South Sudan. Beyond the figures themselves, there are other yet to be considered but essential parameters linked to the cost of vaccines and the methods of purchase, which are not the same in all countries and could therefore have an influence on expenditure on immunization. The quality and availability of existing data is another factor to consider, particularly the reliance on Comprehensive Multi-Year Plan (cMYP) data. While cMYP data are currently the best source of information on the costing and financing of immunizations in LMICs, they are compiled for Gavi applications and may contain inconsistencies in cost definitions and calculations and potentials for weak validation methods.
Conclusion
This study shows that, despite an increase in the GNI per capita of Gavi-eligible countries in SSA, more needs to be done to improve the financing of immunization at a country-level. Furthermore, it demonstrates that an increase in GNI does not necessarily translate into an improvement in immunization coverage. There is a risk of immunization levels depreciating with an immediate effect on program performance, at a time when Gavi is disengaging from these countries. Therefore, there is a significant risk of losing the programs’ achievements after Gavi’s support ends and countries become ineligible. Integrating immunization into essential health services is important for enhancing the sustainability of immunization coverage. Improving equitable access to vaccines, addressing socio-cultural challenges and strengthening healthcare infrastructure could enhance the performance of immunization programs and their relationship to public expenditure in SSA countries.
Another critical takeaway is the Anglophone effect, which requires further exploration to better adapt advocacy in Francophone countries and ensure sustainable improvements in the immunization coverage. Further research is also advised to understand the factors preventing an increase in immunization coverage beyond a certain GNI threshold.
Declarations
Ethics approval and consent to participate
Not applicable
Consent for publication
All authors have read and approved the final manuscript for publication.
Author’s contributions
Conceptualization: AKA
Methodology: AKA, TAE and GCA.
Investigation: AKA, TAE and GCA.
Result analysis: AKA, TAE and GCA.
Writing – original draft: AKA, TAE and GCA.
Writing – review & editing: AKA, TAE, GCA, AA and DKE.
Abbreviations
- CAREC
- Caribbean Epidemiology Centre
- EPI
- Expanded Program on Immunization
- HPV
- Human Papillomavirus
- SSA
- Sub-Saharan Africa
- UNICEF
- United Nations International Children’s Emergency Fund
- WHO
- World Health Organization
- MOH
- Ministry of Health
- RI
- Routine Immunization
- LMIC
- Low- and Middle-Income Countries
- AUCDC
- Africa Union Centre for Disease Control
- cMVP
- Comprehensive Multi-Year Plan
- VPD
- Vaccine Preventable Diseases
- AMP
- Agence de Medicine Preventive
- Gavi
- Gavi the Vaccine Alliance
- DTP3
- Three doses of Diphtheria Tetanus and Pertussis
- Zero-dose
- Incomplete dose of Diphtheria Tetanus and Pertussis
- Under-vaccinated
- Children who have not received the first dose of DTP
- WEIRD
- Western Educated Industrialized Rich and Democratic (WEIRD)
- HIC
- High-Income Countries
- GNI
- Gross National Income
- CPI
- Corruption Perception Index
References
- 1.Essoh T A, G C Adeyanju, A. (2023) Exploring the factors contributing to low vaccination uptake for nationally recommended routine childhood and adolescent vaccines in Kenya. , BMC Public Health 23, 912-10.
- 2.G C Adeyanju, Betsch C, A. (2022) Examining enablers of vaccine hesitancy toward routine childhood and adolescent vaccination in Malawi. Glob Health Res. , Policy 7, 28-10.
- 4.G C Adeyanju, Sprengholz P, Betsch C. (2022) Understanding drivers of vaccine hesitancy among pregnant women in Nigeria: A longitudinal study.NPJ. Vaccines7 96-10.
- 5. (2021) . WHO/UNICEF Estimates of National Immunization Coverage (WUENIC), 2020 Vaccine Impact Modelling Consortium (VIMC) .
- 6. (2022) Gavi Analysis of 2020 WHO/UNICEF Data. In Gavi, the Vaccine Alliance Report. Retrieved 2023.
- 7.G C Adeyanju, Sprengholz P, Betsch C, Essoh T-A. (2021) . Caregivers’ Willingness to Vaccinate Their Children against Childhood Diseases and Human Papillomavirus: A Cross-Sectional Study on Vaccine Hesitancy in Malawi.Vaccines: 9 1231-10.
- 8.Adamu A A, Essoh T A, Adeyanju G C, Jalo R I, Saleh Y et al. (2021) Drivers of hesitancy towards recommended childhood vaccines in African settings: a scoping review of literature from Kenya, Malawi and Ethiopia.Expert Rev Vaccines. 20(5), 611-621.
- 10. (2021) WHO/UNICEF Estimates of National Immunization Coverage (WUENIC). Immunization Coverage: Are We Losing Ground?. 2020b. Retrieved 12, 2023-2020.
- 11.Llau A F, Williams M L, Tejada C E. (2021) National vaccine coverage trends and funding. in Latin America and the Caribbean.Vaccine 39(2), 317-23.
- 12.Chatterjee S, Das P, Nigam A, Nandi A, Brenzel L et al. (2018) Variation in cost and performance of routine immunisation service delivery in India.BMJ Glob Health. 3-3.
- 13. (2019) . WHO/UNICEF Estimates of National Immunization Coverage (WUENIC). Progress and Challenges with Achieving Universal Immunization Coverage .
- 14.Nader A A, C de Quadros, Politi C, McQuestion M. (2015) An analysis of government immunization program expenditures in lower and lower middle-income countries 2006-12.Health Policy Plan.30(3):. 281-8.
- 15.McQuestion M, AGF Garcia, Janusz C, Andrus J K. (2017) National legislation and spending on vaccines. in Latin America and the Caribbean.J Public Health Policy 38(1), 3-15.
- 16.Janet Ouma Tapkigen, Ayomoh Luke, Ifeanyi Francis, Ayeni Gabriel. (2022) Omoniyi. Is health expenditure on immunisation associated with immunisation coverage in Sub-Saharan African countries? medRxiv and bioRxiv, Preprint. , Accessed Sept 2, 2023-10.
- 17.WHO. (2021) Situation Analysis of Immunization Expenditure: KEY FACTS. , WHO. Accessed on Aug 7, 2023-2021.
- 18.Global WHO. (2023) Health Expenditure Database Data on Total (current) Health Expenditure, Primary Healthcare Expenditure Government Health Expenditure. Extracted in.
- 19.Baggio S, Gétaz L. (2019) Current gaps in vaccination coverage: a need to improve prevention and care.Int J Public Health64. 311-312.
- 21.Gavi. (2023) About our Alliance 2021. Available from:https://www.gavi.org/our-alliance/about. , Assessed July 30.
- 22.Daoud A, Reinsberg B. (2019) Structural adjustment, state capacity and child health: evidence from IMF programmes.Int. 48(2), 445-54.
- 24.Griffiths U K, Asman J, Adjagba A, Yo M, Oguta J O et al. (2020) Budget line items for immunization. in 33 African countries.Health Policy Plan 35(7), 753-64.
- 25.Li Baltagi Badi H, D. (2002) Series Estimation of Partially Linear Panel Data Models with Fixed Effects.Annals of Economics and Finance. 3, 103-16.
- 26.Baltagi Badi H. (2021) Econometric Analysis of Panel Data (6th Eds)”. Springer text in Business Economics.
- 29.Baltagi Badi, H. (2014) Panel Data and Difference-in-Differences Estimation (Eds): Anthony. , J. Culyer.Encyclopedia of Health Economics, Elsevier 425-433.
- 30.W John Braun, Huang Li-Shan. (2005) Kernel Spline Regression.”The Canadian. JSTOR, http://www.jstor.org/stable/25046176. Accessed , Journal of Statistics/La Revue Canadienne de Statistique 33, 259-78.
- 32.Ren Grace. (2019) Shifting Health Spending Toward Primary Health Services Saves More Lives & Costs Less. Health Policy Watch.https://healthpolicy-watch.news/shifting-health-spending-toward-primary-health-services-saves-more-lives-costs-less/. Accessed Aug. 3.
- 33.Zhang T, Xu Y, Ren J, Sun L, Liu C. (2017) Inequality in the distribution of health resources and health services in China: hospitals versus primary care institutions.Int J Equity Health. 16(1), 42-10.
- 34.Zhao Y, Chen R, Wang B, Wu T, Huang Y. (2014) General practice on-the-Job training in Chinese urban community: a qualitative study on needs and challenges.PLoS One. 9-94301.
- 35.Xiaoyun L, Shenglan T, Baorong Y. (2012) Can rural health insurance improve equity in health care utilization? a comparison between China and Vietnam.Int J Equity Health. 11, 10-10.
- 36.Agarwal A, Mann C, Abdella E. (2020) Recurrent costs in primary health care in Ethiopia: facility and disease specific unit costs and their components in government primary hospitals and health centers.BMC Health Serv Res20. 389-10.
- 37.Ozawa S, Grewal S, Portnoy A, Sinha A, Arilotta R et al. (2016) Funding gap for immunization across 94 low- and middle-income countries.Vaccine. 34(50), 6408-16.
- 39.L Saura-, Montoliu A, A. (2021) HPV vaccination introduction worldwide and WHO and UNICEF estimates of national HPV immunization coverage 2010-2019.Prev Med. 144106399-10.
- 40. (2023) Human papillomavirus vaccine effect against human papillomavirus infection in Rwanda: evidence from repeated cross-sectional cervical-cell-based surveys.Lancet Glob Health. published online 16-10.
- 41.Sung H, Ferlay J, Siegel R L, Laversanne M, Soerjomataram I et al. (2020) Global Cancer Statistics. GLOBOCAN Estimates of Incidence and Mortality Worldwide for 36 Cancers in 185 Countries.CA Cancer 71(3), 209-249.
- 42.Frick C, Rumgay H, Vignat J, Ginsburg O, Nolte E et al. (2023) Quantitative estimates of preventable and treatable deaths from 36 cancers worldwide: a population-based study.Lancet Glob Health. 25, 2214-109.
- 43.International Agency (2020) for Research on Cancer 2023. Global Cancer Observatory (GLOBOCAN). New Global Cancer Data.
- 44.Adeyanju Gbadebo. (2025) Collins. Immunisation Decision-Making and Barriers to Vaccine Uptake among Children Under-5 in Low-Resource Settings.Scientific Report.Preprint. 10-1101.
- 45.Abreu Liliana, Schrage Pia. (2025) Adeyanju, Gbadebo Collins., Abulfathi, Aisha Aliyu. Caregivers Qualitative Insights on Trust, Resilience and Vaccine Hesitancy Shaping Child Health in Conflict-affected Northeast Nigeria. medRxivPreprint , Bello, Musa Muhammad., Kwaku, Aminatu Ayaba., Jalo, Muhammad Ibrahim., Mahmud, Ahmad., Jalo, Rabiu Ibrahim., Schaub, Max 10-1101.
- 46.Adeyanju G C, Frampton S, Hein C. (2025) Diphtheria and the risk of outbreaks of vaccine- preventable diseases in low-resource settings. Academia Medicine. 2-1.
- 47.Adeyanju G C, Schrage P, Jalo R I, Abreu L, Schaub M. (2025) Armed violent conflict and healthcare-seeking behavior for maternal and child health in sub-Saharan Africa: A systematic review. PLoS ONE. 20(2), 0317094-10.
- 48.Adeyanju GCand Cornelia Betsch. (2024) Vaccination Decision-Making among. Mothers of Children 0 – 12 Months Old in Nigeria: A Qualitative Study. Human Vaccines & Immunotherapeutics .
- 49.Adeyanju G C, Essoh T-A, Sidibe A R, Kyesi F, Aina M. (2024) Human Papillomavirus Vaccination Acceleration and Introduction in Sub-Saharan Africa: A Multi-Country Cohort Analysis.Vaccines. 12-5.
- 50.Adeyanju G C, Engel E, Koch L. (2021) Determinants of influenza vaccine hesitancy among pregnant women in Europe: a systematic review. , European Journal Medical Research 26, 10-1186.
Cited by (1)
This article has been cited by 1 scholarly work according to:
Citing Articles:
BMC Public Health (2026) Crossref