
Modeling of the Deposition of Low-Density Lipoprotein Particles inside an Ideal Geometry of the Heart Coronary Arteries
- Open Access
- Peer Reviewed
- Similarity Checked
- CC BY 4.0
Abstract
In this study, flow hemodynamic parameters and settling of LDL particles in healthy ideal and ideal with stenosis coronary artery have been studied using the Open FOAM software. Not only the effect of movement of the vessel on particles depositions have been studied, but also both non-Newtonian and Newtonian behaviors of blood have been investigated. The particle's motion and deposition have been simulated. It has resulted that only in small vessels, non-Newtonian behavior of blood can be seen and in bigger vessels, there is no remarkable difference between two Newtonian and non-Newtonian models. Vessel movement has no important effects on entered shear stress on its wall, but the alteration in flow lines causes a 70% increment in particles depositions on a vessel with stenosis. This shear stress has no considerable changes with inlet velocity alteration, but it has intensive dependence on geometry in the vessel with stenosis (13 times more oscillation in stenosis location than a healthy vessel).
Article Information
- Received
- Accepted
- Published
Academic Editor: Doaa El Amrousy, Tanta University, Department of Pediatrics.
Checked for plagiarism: Yes
Review by: Single-blind
Copyright © 2022 Nima Sinafar, et al.
 This is an open-access article distributed under the terms of the Creative Commons Attribution License, which permits unrestricted use, distribution, and reproduction in any medium, provided the original author and source are credited.
Corresponding author: Correspondence: Bahador Abolpour, Department of Chemical Engineering, Sirjan University of Technology, Sirjan, Iran —
Competing Interests
There is no conflict of interest. No human studies were carried out by the authors for this article
Funding
No specific funding statement was provided by the authors.
Data Availability
No data-availability statement was provided by the authors.
Citation:
Introduction
Lipoproteins have five types, i.e. Chylomicron, Intermediate Density Lipoprotein, Low-Density Lipoprotein (LDL), Very Low-Density Lipoprotein, and High-Density Lipoprotein, which has different densities from high to low, respectively. LDL is about 20-25 nm spherical particle 1 with 1.019-1.063 gr.mlit-1 density 2, which has an important role in the stenosis of arteries 3. The concentration of these particles in the blood is 100-190 mgr.dlit-14.
Moore et al.5 studied the blood (as an incompressible, homogeny, and Newtonian fluid) flow pattern in a curve tube (with the no-slip boundary condition at its wall), as a candidate for simulating a branch of the coronary arteries. They investigated the effects of different frequencies in the curvature variations in these arteries and resulted that this curvature variation in a 5 Hz frequency is more than 1 Hz frequency. Weydahl and Moore 6 studied the effects of the variations of dynamic curvature on the fluid flow pattern and also the distribution of shear stress on the walls of these arteries. They simulated the motions of these arteries, which have been accrued by the heart beating, as cosine variations. In their study, the bleed was considered as incompressible and Newtonian fluid and the no-slip boundary condition was chosen for the fluid flow at the arteries walls. They resulted that, high variations and curvature increase the risk of stenosis of coronary arteries by increasing of oscillation of the entered shear stress to the walls of these arteries. Prosiet al.7 studied the effects of dynamic curvature (based on empirical measurements) on the homodynamic of the coronary arteries, by solving the 3D Navier-Stokes equations for a pulse flow of an incompressible and non-Newtonian fluid using the arbitrary Lagrangian-Eulerian method. They resulted that, the maximum curvature in these arteries has the maximum chance for stenosis. Pivkinet al.8 presented a 3D simple model for ideal simulation of these arteries. In their model, two cylindrical tubes on the out surface of a sphere (with sine variations of its radius, for simulating the heart beating) were considered. The solving procedure and also fluid flow properties were considered similar to reference 7. They resulted that, the combined effects of inlet flow pulse and the motions of arteries are functions of their phases difference. Kolandavelet al.9 studied the effects of variations of LDL and O2 concentrations in a model of coronary arteries with sine motions. They resulted in that, increasing of LDL concentration and decreasing of O2 concentration, increase the chance of Atherosclerosis accordance. In addition, it was observed that the pulse flow has a more important effect on LDL and O2 concentrations than the arteries motions. Olgacet al.10 studied the transfer mechanism of LDL from the blood flow into the walls of healthy and stenosis coronary arteries. They resulted that, after stenosis and also bifurcation locations have more LDL concentration. Chaichanaet al.11 investigated the effects of different angles in the left coronary artery on the flow pattern and also entered shear stress to the arteries walls. They resulted that a more angle of a bifurcation has a more decrement of this stress. Binu and Kumar 12 studied the effects of stenosis of the left coronary artery on atherosclerosis accordance and approved this harmful effect. Liu et al.13 investigated the entered shear stress and also the pressure gradient to obtain effects of the curvature and angle of an ideal bifurcation on the blood flow properties. The result shows that high stress enters the bifurcation and low stress enters the inner and outer walls of the curve. Pakravanetal.14 studied the entered shear stress to the arteries walls (that have sine motion) by the blood flow as an incompressible and non-Newtonian fluid, using the fluid-structure interaction method. Their results show that the entered shear stresses in the flow direction are different in two cases of wall condition, i.e. with a solid artery wall and fluid-structure interaction. Chiastraet al.15 studied the blood flow pattern (as a laminar and non-Newtonian) in a bifurcation in the left coronary artery, with the no-slip boundary condition at the solid artery wall, with different angles and curvatures of bifurcation in two cases with and without stenosis. They resulted that, the variation of this angle has no considerable effect on this pattern, but decreasing the radius of this curvature increases the entered shear stress by the downstream blood flow to the artery walls. Pinto et al.16 investigated the relationship between Murray’s law (a relationship between the radius and angle of the bifurcations of the blood circulatory system) and the entered shear stress to the arteries walls. They considered the blood flow as a laminar and non-Newtonian flow and resulted that the main effective factor on this stress is the difference between the cross-sections areas of the main and outlet branches. Gholipouret al.17 analyzed a pulse flow of blood, as a non-Newtonian flow, in a bifurcation of the left coronary artery, considering the effects of the heart beating. They resulted that, the maximum shear stress has occurred at the walls of the left main artery and it is the main reason for the tearing of this artery and heart attack, consequently.
The necessity of this research is the identification of locations that have the stenosis chance by deposition of LDLinside an ideal coronary artery. Movements of this vessel by heartbeat have been considered in this simulation. In addition, the effects of stenosis in the ideal model and also effects of Newtonian and non-Newtonian fluids inside this vessel have been investigated. The novelty of this work is the study of LDL deposition inside this vessel using the Euler-Lagrange method.
Methodology
Considering an unsteady-state laminar flow of incompressible blood inside 3D ideal (with constant cross-section area whole the length of arteries 8) geometry of the left coronary arteries, the following Navier-Stokes and continuity equations, have been solved to obtain the fluid flow pattern and also pressure gradient inside these arteries:
 (1)
(1)
 (2)
(2)
Attending to the low volume fraction of solid particles in the fluid flow in this work, the governing equation on the motion of solid particles in the Euler-Lagrange approach has been based as below, considering the entered Drag, Saffman’s lift, pressure gradient, virtual and Brownian forces, respectively 18, 19, 20, 21, 22, 23:
 (3)
(3)
The ideal geometry includes a symmetric 45o bifurcation, which both of its main (with 3 mm diameter and 10.125 and 24 mm lengths before and after bifurcation section, respectively) and side (with 1.5 mm diameter and 12.375 mm length) branches on the outer surface of a sphere (see Figure 1). A symmetric 50% stenosis with 2.5 mm length has been considered at 5 mm distance after the bifurcation section to investigate the effects of stenosis on the homodynamic of blood flow in this geometry. The heart beating, non-Newtonian viscosity of blood, and pulse inlet velocity of the fluid flow have been simulated as below, respectively 8, 24:
 (4)
(4)
 (5)
(5)
 (6)
(6)
The solid wall model with the no-slip boundary condition on it has been used in this study 20. Attending to fast and relative low motions of the arteries walls, the dynamic refine Fv mesh has been used in this study 25. Since the pressure difference between the inlet and outlet flows is ignorable in the comparison with the atmospheric pressure, the pressure outlet boundary condition has been considered at the outlet cross-section of this geometry. 100000 LDL solid particles have been injected into the modeled artery, normal to the inlet flow cross-section. The one-way coupling has been considered in this model 26. The deposition rate of these particles on the artery walls has been defined by deposition factor (DF: the ratio of deposited to injected particles) and deposition efficiency (DE: deposition factor of a section of the artery) 27. The Courant number 28 has been calculated in this un-steady system for obtaining a suitable time steep for convergence of the numerical solution. The calculated optimum value for the time step in this modeling was 10-5. The acceptable accuracy for the calculated values in this numerical solution was considered equal to 10-6.
Results and Discussion
First, the grid study has been presented to show the mesh independence of this numerical solution. For this purpose, the ideal geometry has meshed with 14870, 53144, 126036, and 250144 calculation cells. The results of this study have been presented in Figure 2. As seen in this Figure, 53144 cells have suitable accuracy and calculation time. In the second step, the predictions of the developed model have been compared with the obtained results previous studies 8, 24 for validating the ability of this model to simulate this blood flow and also LDL particles motions and depositions at the walls of this artery (See Figure 3 and Figure 4).
Figure 5 shows the obtained contours of axial velocity of blood flow (as a Newtonian fluid with a constant inlet velocity) and also streamlines of formed secondary flows at different cross-sections of the modeled ideal geometry. The curvature of this artery caused a non-uniform pressure and axial velocity of fluid flow, consequently. The existence of a pressure gradient at each vertical cross-section of the fluid flow causes forming of secondary flows in a direction from the inner wall of curvature to its outer wall. Before the bifurcation, the core of the fluid flow has occurred at the center of the artery and the secondary flows formed two vortex flows with opposite rotation directions. This secondary flow moves the solid particles in a direction from the inner to the outer wall. At the bifurcation section, the similarity of the pattern of the secondary flow has been varied, due to the dividing of the fluid flow to the branches. After this section, in the main branch, the core of fluid flow is smaller than the flow before this bifurcation and its location has been moved toward the outer wall. In addition, the secondary flow and also two vortexes have been formed, again. In the side branch, the effects of fluid viscosity are higher than the effects of curvature on the fluid, due to the low volume flow rate and velocity, therefore a weak secondary flow has been formed at this section. The presented axial velocity profiles in this Figure show that, at the bifurcation, the maximum value of this velocity has been located around the center of the artery. Nevertheless, after this bifurcation, this maximum value is leaning to the outer wall of the artery curvature.
Figure 6 shows the effects of pulse inlet flow on these contours and profiles of axial velocity of blood flow and also streamlines of formed secondary flows at the bifurcation cross-section. It is clear that the pulse inlet flow has no considerable effects on the structure of the formed secondary flow at this section, but changes the maximum velocity with time. The existence of a minor difference between these profiles at t/θ = 0 and t/θ = 0.5, which have a similar inlet flow velocity, has been raised from the effects of the fluid viscosity, which cause a delay in the transformation of momentum along the artery. These velocity variations cause fluid flow acceleration around solid particles and affect the motion mechanism of these particles within the passing fluid flow. Figure 7 shows the effects of artery cosine movement, due to heart beating, on these parameters at this cross-section. It is clear that this movement changes the pattern of the formed secondary flow at this section and the maximum difference between the maximum values of the flow velocity is at t/θ = 0.25, where the sine function of the speed of the artery movement is at its maximum domain.
Figure 8 shows the obtained profiles and contours of axial velocity of blood flow (as a Newtonian fluid with a constant inlet velocity) and also streamlines of formed secondary flows at different cross-sections of the modeled ideal geometry of coronary arteries with stenosis. It is clear that, before bifurcation, all the secondary flow streamlines are toward the side branch and there is no vortex in the fluid flow. In addition, it is observed that, in this section, the velocity profile is similar to the healthy artery. At the stenosis cross-section, the velocity and core of the fluid flow have been grown and all the secondary flow streamlines are toward the center of the cross-section. After this stenosis section, the core of the fluid flow has been moved toward the outer wall of the artery curvature, and an irregular secondary flow has been formed at this section, due to the existence of a negative flow velocity. Such sections of the artery after stenosis, which have a negative fluid flow at the inner side of the artery curvature, have a high chance of forming secondary stenosis. In the side branch, a double vortex secondary flow has been formed, unlike the healthy artery.
The calculated volume flow rate distribution by the presented model has been compared with the predicted values by Murray’s law that has been developed for a bifurcation in a fixed healthy artery with a constant inlet flow (i.eQ ∝ d3 ⇒ Qside branch/Qmain branch = (dside branch/dmain branch)3)16. In this case, the prediction of the present model for this ratio is 0.123, which has about 1% variance from the predicted value (i.e. 0.125) by this law. The artery movements and also pulse inlet flow affect this distribution, as shown in Figure 9. It is observed that the pulse inlet flow has a more important effect on this ratio than the artery movements. Figure 10 shows the effects of stenosis on this parameter. It is clear that this law has not a suitable prediction in this case. In addition, the artery movements have more importance in this case.
One of the hydrodynamic parameters that have an important role in the type and location of occurring heart attack is the entered shear stress by the blood flow to the arteries walls, which is a function of the fluid flow gradient near these walls. Empirical measuring of this parameter is too hard; therefore, mathematical simulation of the blood flow inside these arteries is a suitable candidate for calculating this parameter. Figure 11 shows the obtained contour and profiles of the entered shear stress by the fluid flow to the walls of a healthy artery with a static mesh using the present model. The minimum values of this parameter have been located at the inner wall of the curvature of the main branch and also at the outer wall of the curvature of the side branch. It is observed that the gradient of this parameter at the bifurcation is considerable. Since the curvature of this artery leads the fluid flow toward the outer wall of this curvature (i.e.Epircardial wall), therefore the minimum value of the entered shear stress has been entered to the inner wall of this curvature (i.e. Myocardial wall). The fluid flow separation causes entering low shear stress to the initial section of the outer wall of the curvature of the side branch (i.e. Outer wall). Figure 12 and Figure 13 show the effects of the pulse inlet flow and the artery movement due to the heart beating on the entered shear stress by the blood flow to the artery walls. It is clear that the pulse inlet flow velocity has more important effects on this parameter. Figure 14 shows the effects of stenosis on the entered shear stress to the artery walls. It is observed that the minimum shear stress has been entered to the inner and outer walls of the artery curvature and the maximum shear stress has been entered to the artery wall before its stenosis. Therefore, the entered shear stress to these artery walls has considerable variations whole the artery length, and these variations can increase the extent of this stenosis.
Figure 15 and Figure 16 show the effects of considering the blood flow (with a constant inlet velocity) as a non-Newtonian fluid on its axial velocity profile and also entered shear stress to the healthy fixed artery walls by this flow. It is clear that the obtained results are similar for these two cases of this fluid flow, and only some differences have been observed between these profiles inside the side branch, due to its small diameter. The presented viscosity contours for different cross-sections of this artery in this Figure show a different distribution of the fluid viscosity, which causes different effects on the fluid flow. Figure 17 and Figure 18 also present similar axial velocity profiles and entered shear stresses to the inner walls of the artery curvature for the Newtonian and non-Newtonian fluids in an artery with stenosis. Therefore, there are no considerable differences between the obtained results considering Newtonian and non-Newtonian fluid flows.
Table 1 presents the obtained results by the model for deposition of LDL particles on the walls of a healthy artery. These results approve the effects of the artery movements, due to the heart beating, on the deposition of these particles. Since these movements are perpendicular to the blood flow direction inside the artery, therefore these movements increase the deposition of LDL particles on the artery walls. Figure 19 shows the deposition of these particles on the walls of this moving healthy artery, considering a constant inlet velocity of this Newtonian fluid flow. It is the observer that, these particles have been deposited on the bifurcation, inner and outer walls of the artery curvature, due to the existence of a high shear stress gradient at the bifurcation, low shear stresses at the inner wall of the curvature, and separation of solid particles from the streamlines toward the outer wall of this curvature. Table 2 presents the obtained results by the model for deposition of these particles on the walls of an artery with stenosis. Figure 20 shows the deposition of these particles on the walls of this moving artery with the stenosis, considering a constant inlet velocity of this Newtonian fluid flow. The variations of the entered shear stress to the artery wall at the stenosis section increased the rate of solid deposition at this section.
Figure 1. The ideal geometries of the modeled healthy bifurcation and the bifurcation with stenosis.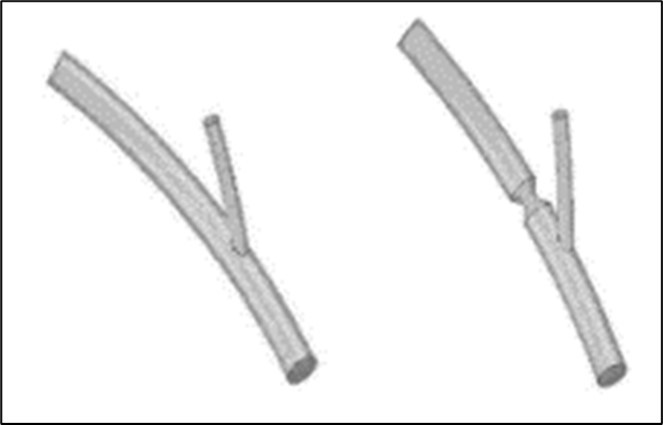
Download figure
Figure 2. Grid study.
Download figure
Figure 3. Validation of the model (with a static mesh) predictions for the fluid flow separation in the bifurcation using the obtained results byPivkin et al. 8.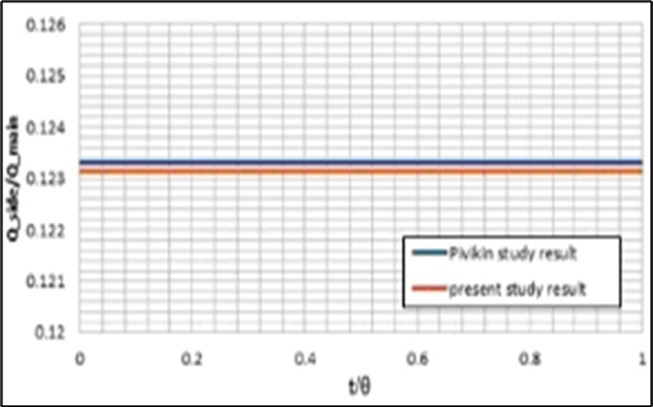
Download figure
Figure 4. Validation of the model predictions for the centerline velocity ofa non. Non-Newtonian fluid flow in the length of theshown geometry in this Figure using the obtained results byJeong and Rhee 24.
Download figure
Figure 5. a) Contours of axial velocity of blood flow and streamlines of formed secondary flows at different cross sections, and b)axial velocity profilesat the mentioned lines in the modeled ideal geometry.
Download figure
Figure 6. Effects of pulse inlet flow on the contours and profiles of axial velocity of blood flow and streamlines of formed secondary flows at the bifurcation cross section.
Download figure
Figure 7. Effects of heart beating on the contours and profiles of axial velocity of blood flow and streamlines of formed secondary flows at the bifurcation cross section.
Download figure
Figure 8. a)Contours of axial velocity of blood flow also streamlines of formed secondary flows, and b) axial velocity profiles of this fluid flow at different cross sections of the modeled ideal geometry of coronary arteries with a stenosis.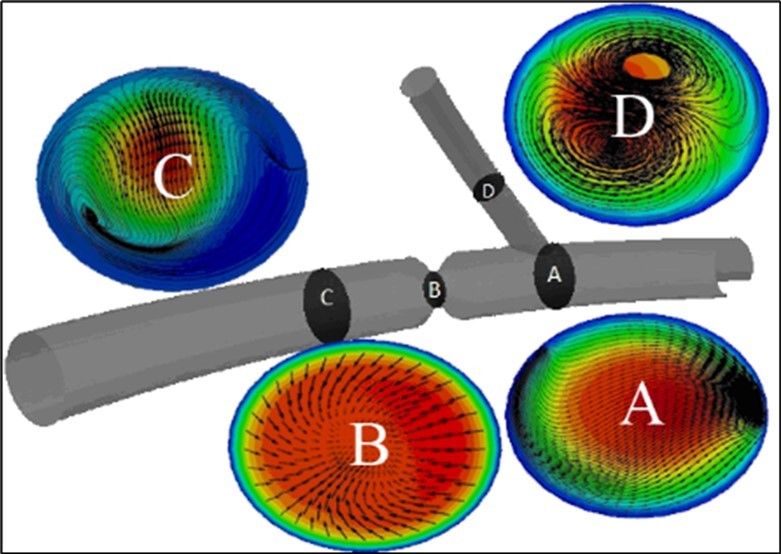
Download figure
Figure 9. Effects of the artery movements and pulse inlet flow onthe fluid flow separation in the bifurcation.
Download figure
Figure 10. Effects of the stenosis onthe fluid flow separation in the bifurcation.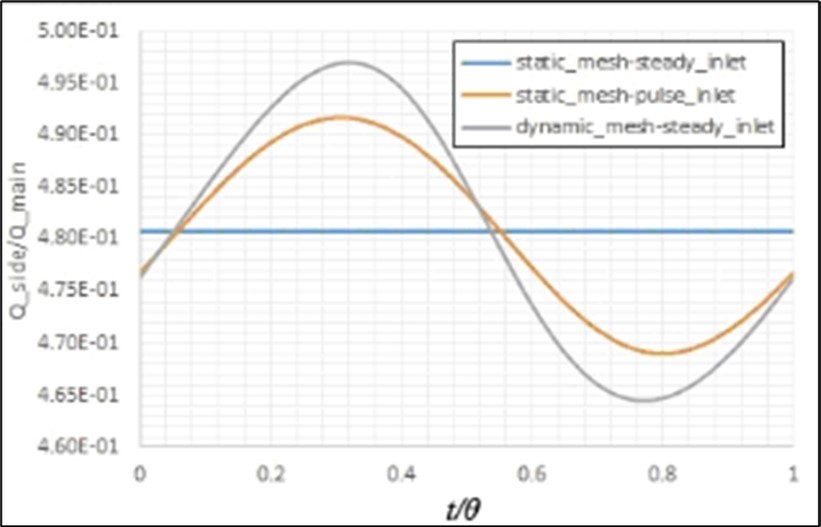
Download figure
Figure 11. a)Contour and b)profiles of the entered shear stress by the fluid flow to the walls of a healthy artery with a static mesh using the present model.
Download figure
Figure 12. Effects of the pulse inlet flow on the entered shear stress by the blood flow to the artery walls.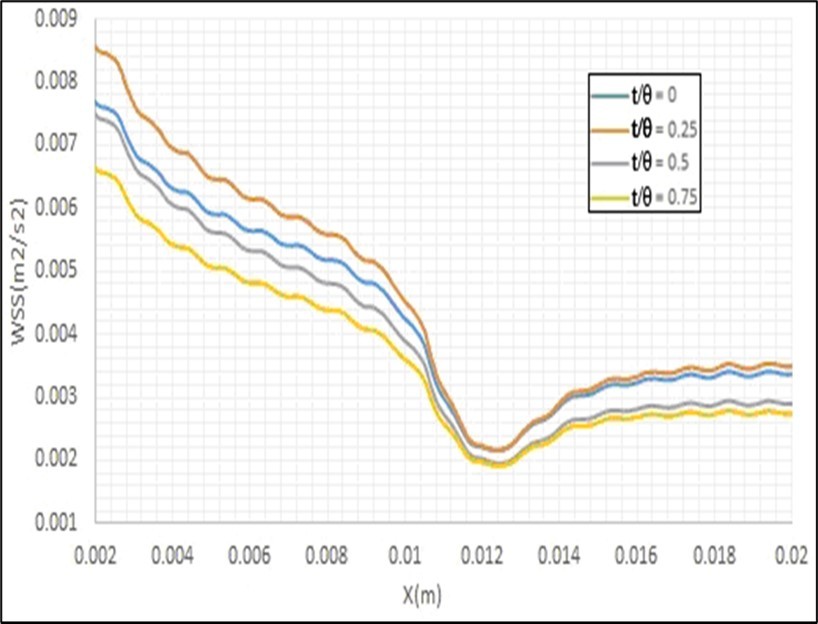
Download figure
Figure 13. Effects of the artery movement due to the heart beating on the entered shear stress by the blood flow to the artery walls.
Download figure
Figure 14. a)Contour and b)profiles of the entered shear stress by the fluid flow to the walls of an artery with a stenosis using the present model with a static mesh.
Download figure
Figure 15. Effects of considering of the blood flow as a non. Non-Newtonian fluid on the axial velocity profile and the viscosity contours at different cross sections (i.e.a) at the bifurcation, b) 6d after the bifurcation and c) 2d before the bifurcation) of the healthy artery. 
Download figure
Figure 16. Effects of considering of the blood flow as a non. Non-Newtonian fluid on the entered shear stress to inner wall of healthy artery curvature. 
Download figure
Figure 17. Axial velocity profiles for the Non-Newtonian and non. Non-Newtonian fluids at different cross sections (i.e.a) at the bifurcation andb)1d after the bifurcation)of an artery with a stenosis. 
Download figure
Figure 18. Effects of considering of the blood flow as a non. Non-Newtonian fluid on the entered shear stress to inner wall of an artery curvature with a stenosis.
Download figure
Figure 19. Deposition of LDL particles on the walls of the moving healthy artery. 
Download figure
Figure 20. Deposition of LDL particles on the walls of the moving artery with the stenosis.
Download figure
| Fluid | Mesh | Inlet flow | Total deposition factor | Number of deposited particles before the bifurcation | Number of deposited particles after the bifurcation in the main branch | Number of deposited particles in the side branch |
|---|---|---|---|---|---|---|
| Newtonian | Static | Constant | 5.42×10⁻³ | 0 | 542 | 0 |
| Newtonian | Static | Pulse | 5.24×10⁻³ | 0 | 524 | 0 |
| Newtonian | Dynamic | Constant | 6.83×10⁻² | 123 | 6858 | 119 |
| Non-Newtonian | Static | Constant | 4.83×10⁻³ | 0 | 483 | 0 |
| Fluid | Mesh | Inlet flow | Total deposition factor | Number of deposited particles before the bifurcation | Number of deposited particles after the bifurcation in the main branch | Number of deposited particles in the side branch |
|---|---|---|---|---|---|---|
| Newtonian | Static | Constant | 6.56×10⁻² | 0 | 6595 | 0 |
| Newtonian | Static | Pulse | 6.71×10⁻² | 0 | 6705 | 0 |
| Newtonian | Dynamic | Constant | 1.15×10⁻¹ | 79 | 11189 | 111 |
| Non- Newtonian | Static | Constant | 6.74×10⁻² | 0 | 6742 | 0 |
Conclusions
In the presented study, the blood flow in an ideal geometry of the coronary arteries with different wall boundary conditions has been modeled using the OpenFOAM software. The motion and penetration of LDL particles on the walls of these arteries have been investigated to obtain the locations with a high chance for stenosis. Comparing the fluid flows as Newtonian and non-Newtonian fluid flows indicated that, in small diameter arteries, there are some differences between the predicted results by the model for these cases. The movements of the artery wall, due to the heart beating, and also pulse inlet flow of the blood cause entering of some shear stress by the fluid flow to this wall, especially in an artery with stenosis. This artery movement, which is perpendicular to the blood flow inside it, increases the deposition of LDL particles on its walls. The locations in this artery that have considerable chances for Atherosclerosis occurrence, due to the special conditions of entered shear stress by the fluid flow to the walls of these sections, have been obtained using the predictions of the developed model.
Symbols
C D - Drag coefficient
d - Artery diameter
d ij - Strain tensor
d p - Diameter of LDL spherical particle
K S - Constant
m p - Mass of solid particle
p - Pressure
Q - Volume flow rate of the fluid
q - Constant
R 0 - Average radius of the spherical heart
S 0 - Gaussian white noise process
t - Time
U0 - Constant inlet velocity of fluid flow
v p - Velocity of LDL spherical particle
x p - Location of solid particle
δ - Beating domain variations coefficient
ε - Constant
θ - Time period of spherical heart radius variations
λ - Constant
µ - Fluid viscosity
µ 0 - Constant
µ ∞ - Constant
υ - Fluid kinematic viscosity
ρ - Fluid density
ρ p - Density of LDL spherical particle
τ - Required time for action of particle to the velocity variations of fluid ( τ = ρpdp2 / 18 µ )

Conflict of Interest
References
- 1.Murtola T, T A Vuorela, M T Hyvönen, S J Marrink, Karttunen M et al. (2011) Low density lipoprotein: Structure, dynamics, and interactions of apoB-100 with lipids. , Soft. Matter 7, 8135-41.
- 2.Prassl R, Laggner P. (2012) Lipoprotein Structure and Dynamics: Low Density Lipoprotein Viewed as a Highly Dynamic and Flexible Nanoparticle,Lipoproteins - Role Heal Dis.
- 3.J E Hall, A C Guyton. (2001) . Guyton and Hall Textbook of Medical Physiology 12thEd,VRG. Elsevier/Saunders .
- 4.Hao W, Friedman A. (2014) The LDL-HDL profile determines the risk of atherosclerosis: A. mathematical model. 9
- 5.J E Moore, E S Weydahl, Santamarina A. (2002) Frequency Dependence of Dynamic Curvature Effects on Flow through Coronary Arteries,J BiomechEng.
- 6.E S Weydahl, J E Moore. (2001) Dynamic curvature strongly affects wall shear rates in a coronary artery bifurcation model,J. , Biomech 34, 1189-1196.
- 7.Prosi M, Perktold K, Ding Z, M H Friedman. (2004) Influence of curvature dynamics on pulsatile coronary artery flow in a realistic bifurcation model,J. Biomech,37: 1767-175.
- 8. (2005) Combined effects of pulsatile flow and dynamic curvature on wall shear stress in a coronary artery bifurcation model,J. , Biomech 38, 1283-1290.
- 9. (2006) The effects of time varying curvature on species transport in coronary arteries,Ann. , Biomed Eng 34, 1820-1832.
- 10. (2009) Patient-specific threedimensional simulation of LDL accumulation in a human left coronary artery in its healthy and atherosclerotic states,Am. , J PhysiolCircPhysiol 296, 969-982.
- 11. (2011) Computation of hemodynamics in the left coronary artery with variable angulations,J. , Biomech 44, 1869-1878.
- 12.L S Binu, A S Kumar. (2012) Simulation of Left Main Coronary Bifurcation Lesions using 3D Computational Fluid Dynamics Model and its Comparison with 2D,Proc World CongrEng. , I: 4-9.
- 13.Liu G, Wu J, Ghista W Huang D N, Wong K K L. (2015) Hemodynamic characterization of transient blood flow in right coronary arteries with varying curvature and sidebranch bifurcation angles,ComputBiol. , Med 64, 117-126.
- 14.H A Pakravan, Saidi B Firoozabadi M S. (2017) The Importance of Fluid-Structure Interaction Simulation for Determining the Mechanical Stimuli of Endothelial Cells and the Atheroprone Regions in a Coronary Bifurcation,Sci Iran. 23, 228-237.
- 15.Chiastra C, Gallo D, Tasso P, Iannaccone F Migliavacca F, Wentzel U Morbiducci J J. (2017) Healthy and diseased coronary bifurcation geometries influencenear-wall and intravascular flow: A computational exploration of the hemodynamic risk,J. , Biomech 58, 79-88.
- 16.Doutel E, Pinto SIS, Campos JBLM, Miranda J M. (2016) Link between deviations from Murray’s Law and occurrence of low wall shear stress regions in the left coronary artery,J TheorBiol. 402, 89-99.
- 17.Gholipour A, M H Ghayesh, Zander A. (2018) Nonlinear biomechanics of bifurcated atherosclerotic coronary arteries,Int. , J EngSci 133, 60-83.
- 18.Rashidi S, Bovand J AbolfazliEsfahani M, Ahmadi G. (2016) Discrete particle model for convective AL2O3-water nanofluid around a triangular obstacle,ApplThermEng. 100, 39-54.
- 20.Malve M, Garcia A, Ohayon M A Martinez J. (2012) Unsteady blood flow and mass transfer of a human left coronary artery bifurcation: FSI vs. CFD,IntCommun Heat Mass Transf,39:. 745-751.
- 21.Wen D, Zhang L, He Y. (2009) Flow and migration of nanoparticle in a single channel,Heat Mass Transf Und Stoffuebertragung. 45, 1061-1067.
- 22.Drew D, Cheng L, R T Lahey. (1979) The analysis of virtual mass effects in two-phase flow,Int. , J Multiph Flow 5, 233-242.
- 23.Li A, Ahmadi G. (1992) Dispersion and deposition of spherical particles from point sources in a turbulent channel flow,Aerosol. , SciTechnol 16, 209-226.
- 24.Jeong K Rhee W W. (2009) Effects of surface geometry and non-newtonian viscosity on the flow field in arterial stenosis,J. , Mech SciTechnol 23, 2424-2433.
- 25.Jasak H. (2009) Dynamic Mesh Handling. in OpenFOAM,47th AIAA AerospSci Meet Incl New Horizons Forum Aerosp Expo 1-27.