
Abstract
A cohort of Pony Club horses was observed for 13 months with data collected from owner-kept diaries and monthly property visits. All horses studied had access to pasture for all or part of the day. Whilst paddock size was seldom limiting, pasture degradation was evident and observed pasture mass and composition varied greatly. Horses’ body weight indices and body condition scores also varied greatly, closely matching seasonal variations in pasture mass. Increments in bodyweight varied in a non-linear fashion with body condition score. Most horses experienced additional year-round hand-fed supplementation and half of the study horses recorded body condition scores greater than 3.5 out of 5. This suggests that the owners of Pony Club horses did not rely on pasture as the sole source of nutrition, even though, based on estimated energy demands, well-managed pasture can meet the energy requirements of Pony Club horses. Furthermore, the fact that owners appeared not to make horse feeding decisions based on body condition score resulting in obesity, raises health and welfare concerns in this cohort of horses. The inappropriate feeding of supplements observed during times of high pasture growth was a concern.
Whilst the ideal pasture for Pony Club horses has not been described, it is likely to differ to those considered ideal for broodmares and other livestock because of these unique health risks associated with high levels of non-structural carbohydrate content in improved pasture species. This study highlights the need to educate owners about recognising unhealthy body conditions of horses and better managing pastures and pasture access to reduce the risk of obesity related disorders, whilst at the same time reducing pasture degradation and supplemental feed costs
Author Contributions
Academic Editor: Mohammed Elmetwally, Assistant Prof of Theriogenology
Checked for plagiarism: Yes
Review by: Single-blind
Copyright © 2018 Petra Buckley. et al.
 This is an open-access article distributed under the terms of the Creative Commons Attribution License, which permits unrestricted use, distribution, and reproduction in any medium, provided the original author and source are credited.
Competing interests
The authors have declared that no competing interests exist.
Citation:
Introduction
In an evolutionary context, horses have been described as ‘plains feeders’, digesting in their caecum material that ruminants generally avoid (McGreevy, 2004)20. Due to their small stomachs, horses ‘trickle feed’, eating small amounts frequently (McGreevy, 2004)20. In Australia, most horses other than racing Thoroughbreds and Standardbreds have access to pasture, and pasture is an important source of nutrients for these horses. Factors such as pasture composition, stocking rate, climate, soil quality, and size of paddock all impact on the quality of nutrition that grazing animals obtain from pastures (Avery, 1997)1. Good quality pastures (e.g. perennial ryegrass and white clover in New Zealand) can fully meet the energy and nutrient requirements of lactating mares with foals at foot (Hunt, 1997)11. The type of pasture that could provide appropriate nutrition to recreational horses without lactation demands has not been well defined. In comparison to pastures grazed by sheep and cattle, horse pastures are often agronomically poor, grazed unevenly, predominated by weeds, and nutritionally inadequate (Hunt, 1997)11. Horses grazing such pastures often require supplemental feed, particularly in situations where pasture regrowth is not possible (e.g. in a set-stocking situation or with high stocking rates). Paddocks that are overstocked provide little benefit other than as exercise areas (Hunt, 1997)11. Despite impacting recreational horse health and welfare, there exists a general lack of published information on the relative feeding value of different pastures and forages grazed by horses (Hoskin and Gee, 2004)10. Pasture improvements typically select grasses with increased nutrient density, vigour, extended grazing season, disease resistance and cold and drought resistance but inadvertently also select for increased non-structural carbohydrate content (Watts, 2004)25. This non-structural carbohydrate content of pasture has received attention because of its potential role in horse diseases such as laminitis, equine metabolic syndrome and equine polysaccharide storage myopathy (Watts, 2004)25. Pasture composition, daily supplemental feeding practices, obesity, and lack of exercise may also be risk factors for misbehaviour in Pony Club horses (Buckley et al., 2013)5.
Given the paucity of information about pasture based nutrition in recreational horses, the aims of this study were to describe the pastures grazed and the body weights and body condition scores of a cohort of Australian Pony Club horses kept primarily for recreational use. A prospective longitudinal design was used, with the horses’ body weight, body conditions scores and pastures allocated assessed monthly, for 13 months.
Materials and Methods
The study was approved by the Charles Sturt University Animal Care and Ethics committee.
Study Population
The pastures grazed by 84 eligible Pony Club horses, ridden by 69 children belonging to 41 families that were current members of a Pony Club, were enrolled in the study, and the body weights, body condition scores, stocking rates and characteristics of these pastures were monitored monthly between June 2000 and July 2001. For some calculations, only the 48 horses that contributed more than 10 months of data were included.
Selection Process
A four-stage selection process was used to select participating Pony Club families and their horses. Firstly, a NSW Pony Club Zone was selected, followed by selection of Clubs within that Zone, families within each club and horses within each family. The NSW Pony Club Zone 12 is a rural region in temperate southern New South Wales and it was chosen due to its proximity to the researchers. To facilitate repeated travel to Pony Clubs and horses, clubs located within a 100 km radius from Wagga Wagga were chosen for inclusion into the study. Seven clubs were within this radius and all were selected. Computer generated random numbers from Microsoft Excel© (version 2002) were used to select 50 families listed in the Zone 12 Pony Club area in the year 2000. The number of families selected from each of the seven clubs was roughly in proportion to the number of families in each club; about 30% of each club were surveyed. Sample size calculations were not undertaken; instead an attempt was made to enrol a total of 50 families. This target represented the number of families that the principal researcher (PB) could realistically manage in a prospective longitudinal study of this nature.
Each study family's farm was visited monthly. Horses were enrolled at the time of the first visit to each farm. Horses meeting the following criteria were eligible for enrolment:
The horse was owned or leased and exclusively cared for by that family.
The horse was used only for Pony Club purposes.
The horse was regularly ridden by someone within the family who was a riding member of Pony Club.
The horse had participated at more than six Pony Club events during the previous year.
All eligible horses were enrolled. Horses purchased or leased after the first visit that met eligibility criteria were eligible for late enrolment.
Data Collection
Data was collected by 2 researchers (PB and DJB). Horse body weight, body condition score and pasture data were collected at each monthly visit. Diaries describing preventative health care (Buckley et al., 2016)3, supplemental feed, exercise and pasture access by study horses were kept by each family. Diary entries were inspected, copied and clarified by the investigators monthly with the horse owners. Horse body weight was measured using electronic, portable live weight scales, and body condition score assessed on a scale of 1-5 recommended by (Carroll and Huntington, 1988)6. This method uses visual assessment of body fat deposition in neck, back, ribs pelvis and rump and palpation of neck muscle firmness and bony protuberances or lack thereof along the back, ribs and pelvis (Table 1). Body condition scores were usually recorded as integers or half integers (e.g. 3.5). A body condition score of three is considered ideal.
Table 1. Guide to field assessment of body condition score of study horses by palpation based on anatomical differences between different body condition scores, based on Huntington (1991)| Condition | Neck | Back & Loin | Ribs | Hind Quarters |
| 0 Very poor | Marked ewe neck | Very prominent backbone and pelvis | Skin tight over bones | Deep cavity under tail, very sunken rump |
| 1 Poor | Ewe neck – narrow and slack | Prominent backbone and croup | Ribs easily visible | Cavity under tail, sunken rump |
| 2 Moderate | Narrow but firm neck | Backbone well covered | Ribs just visible | Flat rump either side of backbone |
| 3 Good | No crest, firm neck | No gutter | Ribs just covered but easily felt | Rounded rump |
| 4 Fat | Slight crest | Gutter along back | Ribs hard to feel | Pelvis hard to feel, rump well rounded |
| 5 Very fat | Marked crest, lumps of fat | Deep gutter along back | Ribs buried, lumps of fat | Very bulging rump, lumps of fat |
At each monthly visit, horses were led onto electronic portable live weight scales and their bodyweight was recorded in kilograms. To enable comparison of the bodyweight changes in horses of different frame size a bodyweight index was created by expressing each monthly bodyweight as a ratio relative to the average bodyweight of the horse over the duration of the study;

To allow comparison of bodyweight index changes with seasonal pasture availability, average pasture mass on offer to all horses was calculated for each calendar month and averaged for each season. This was graphed on the same axes as mean body weight index across all study horses for that season.
Pasture data collection consisted of an assessment of stocking rate, pasture composition and pasture biomass available to each of the study horses (Table 2). All paddocks grazed by a study horse for longer than a week, since the last visit, were assessed. If any study horse grazed more than one paddock during the study month, data from those paddocks grazed by study horses for a week or greater were averaged for the month.
Table 2. Data collected about paddock size, pasture composition and available biomass for 84 Pony Club horses| Variable | Measurement method | Recording |
| Paddock size | Distance wheel rolled along circumference of paddock, and distance was read off the dial. Shape of paddock was recorded as either a rectangle or triangle | Area in square meters |
| Pasture composition | 200 visual point estimates using a ‘wingdinger’* (2 intersecting rods) thrown on the pasture along a predetermined representative line through the paddock | % grass, legume, weed, dead and non-vegetable material, bare (common plant species were identified by an agronomist and recorded) |
| Available pasture mass | 0.5m x 0.5 m quadrant placed in 3 representative positions on pasture area, which was cut close to ground level with electric clippers, then oven dried at 60-70°C for at least 2 days. Dry weight was then converted to kgDM/ha. | kgDM/ha of available pasture |
Stocking Rate
Stocking rate was calculated as the number of dry horse equivalents per hectare. Other livestock, including sheep, goats and steers occasionally shared the pasture with the study horses. The stocking rate was adjusted to take into account the dry stock equivalent (DSE) ratings of these other stock. DSE values used were: merino wether 1.0, goat 1.0, steer 10.0, ponies 6.0, and light horse 10.0 (Avery, 1997)1.
Paddock Size, Pasture Composition and Available Pasture Mass
Weather
The long term mean annual rainfall in Wagga Wagga is 567mm (http://www.bom.gov.au/climate/averages). Although the monthly rainfall is relatively evenly distributed between season daily evaporation in summer frequently exceeds 10mm per day. The hot, dry conditions between November and March limit potential pasture growth. The observed seasonal rainfall ranged from 95.8mm in autumn to 128.8mm, 181.2mm and 203.8mm for summer, spring and winter, respectively. Mean daily minimum temperatures observed during the study period ranged from 3.6oC (winter) to 16.8oC (summer) and maximum temperatures ranged from 13.3oC (winter) to 33.2oC (summer), respectively (Bureau of Meteorology).
Statistical Analysis
Data collected were entered, checked and prepared for analysis into a Microsoft® Access database by the researcher (PB). Relevant data were exported for descriptive analysis in Statistix®7and Stata Statistical Software, release 9.0 (StataCorp. 2005)7.
A linear regression model was built to estimate the slope of the association between bodyweight as a dependent variable and body condition score as a categorical explanatory variable. Interactions between variables were tested using a multiple Wald test. The interaction between height and body condition score was significant (p = 0.0137), and was included in the model. The magnitude of the change in bodyweight with changes in body condition score was therefore dependent on horse height.
Results
Description of Study Horses
A total of 84 horses were enrolled in the study, and 48 of these were studied for 10 to 13 months. The majority of study horses (60.7 % or 51 / 84) were geldings with the remaining 33 being mares. Fifty-six percent of horses were classified as ponies based on size, that is height at wither measuring less than 145 cm. The mean height was 140 cm, with a range of 90 cm to 167.5 cm. Although in the minority, a number of horses (13.1 % or 11 / 84) were 160 cm high or taller.
Most horses were not purebred, with 54.8 % (46 / 84) reported by owners as either crossbreds or breed unknown. The largest group of known breed was Thoroughbred, with 20.2 % (17 / 84) of horses in this category.
Exercise Patterns of Study Horses
A summary of exercise patterns observed for study horses is presented here to provide context for the pasture data. The complete information is published elsewhere (Buckley, 2009)2. Study horses were generally exercised infrequently and for short periods. Exercise sessions ranged from 15 minutes to several hours per day exercised; the shorter durations reflected riding for pleasure and schooling, with the longer ones generally occurring on competition days. Horses experienced a median of 6 exercise days and a median of 10 exercise hours each horse-month
All study horses had access to pasture permitting self-exercise and grazing for either part or all of each day, throughout the study.
Body Weight
Bodyweight data were analysed for the 48 horses that each contributed 10 to 13 horse-months to the study. Bodyweights of horses varied substantially during the study. This was partly due to variation within horses over time, where changes in bodyweight in 52 % (25 / 48) of horses varied between 21 and 44 kg during the study period. For 44 % (21 / 48) of horses, bodyweight changes varied between 46 and 82 kg.
Body Weight Index
An index value of one indicates that the horse’s bodyweight on that visit day was equal to the horse’s mean bodyweight for the study. A value of greater than one indicates that the horse weighed more than its mean bodyweight at that horse-month. A value of less than one indicates that the horse weighed less than its mean bodyweight at that horse-month. One horse had a maximum bodyweight index of 1.51. The mean bodyweight index for 540 horse-months for the 48 horses present in the study for at least 10 months was 1.01 with a range of 0.86 to 1.51. Mean bodyweight index varied by season with highest values in spring and summer and lowest values in winter. This seasonal pattern closely matched that for mean pasture mass (Figure 1).
Figure 1.Mean bodyweight index (bwindex) of 48 Pony Club horses that were examined monthly for 10-13 consecutive months and mean pasture mass (dm) on visit day in paddocks grazed by these 48 horses by season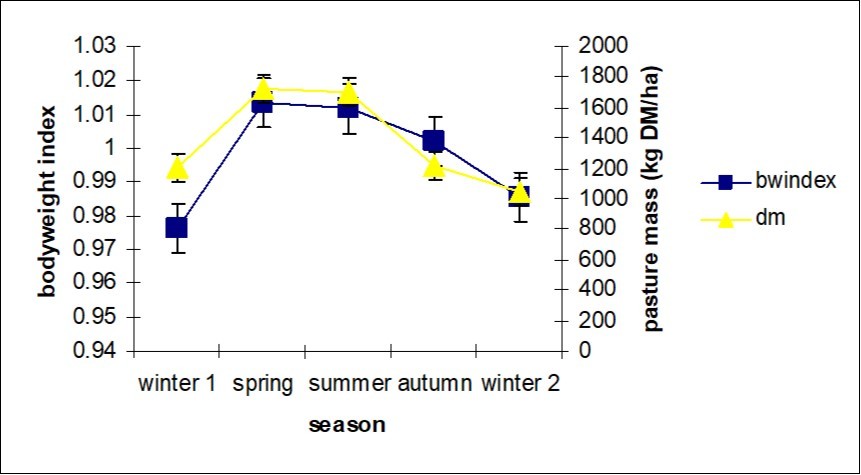
Body Condition Score
Body condition scores were recorded at 540 (97%) of 559 monthly assessments. The median condition score was 3.5. The most common body condition score was three but scores varied widely, from two to five (Figure 2). Body condition score was above 3.5 at 230 (43%) of the 540 assessments. Over the study period, body condition scores varied within horses by 0 to 2.5 body condition score units. For 28 (58%) of the 48 horses, body condition scores varied by at least 1.5 units over the study period.
Figure 2.Frequency distribution of body condition scores at 540 monthly visits for 48 Pony Club horses that were examined monthly for 10 to 13 consecutive months
The median condition score of study horses was 3.5, with a within-horse range of body condition score varying from 0 to 2.5. The most common body condition score for the 48 horses examined monthly over 10 to 13 months was three but scores varied widely, from two to five (Figure 2).
Highest values were observed in spring and lowest values in winter (Figure 3). Relative to winter 1, mean body condition score was significantly higher in spring (P<0.001), and autumn (P=0.006) but not significantly different in summer (P=0.121) or winter 2 (P=0.105). Median body condition score had a similar seasonal pattern to bodyweight index with a sharp increase from winter to spring, followed by a gradual decline to the next winter (Figure 3).
Figure 3.Seasonal variation in median body condition scores (cscore) and mean bodyweight indices (bwindex) on visit day for 48 Pony Club horses that were examined monthly for 10 to 13 consecutive months
Association between Body Condition Score and Bodyweight
The association between body condition score and bodyweight was modelled using body condition score as a categorical (ordinal) variable. Table 3
The magnitude of change in body weight for horses of different heights was also calculated in Table 4.
Table 3. Coefficients, p-values and confidence intervals when modelling bodyweight and body condition score| Variable | Coefficient | 95% ConfidenceInterval | P value | |
| Condition score (CS) | ||||
| 2* | -17.8 | -31.2 | -4.5 | 0.009 |
| 2.5* | -11.1 | -16.8 | -5.5 | 0.000 |
| 3 | Reference category | |||
| 3.5* | 8.4 | 3.7 | 13.1 | 0.000 |
| 4* | 15.5 | 11.4 | 19.6 | 0.000 |
| 4.5* | 21.2 | 15.6 | 26.9 | 0.000 |
| 5* | 38.5 | 30.5 | 46.4 | 0.000 |
| Height (per cm) | 5.8 | 5.1 | 6.5 | 0.000 |
| CS * height interaction terms (per cm)_ | ||||
| CS 2*height interaction^ | 0.4 | -0.4 | 1.3 | 0.299 |
| CS 2.5*height interaction^ | 0.3 | -0.2 | 0.7 | 0.214 |
| CS 3.5*height interaction^ | 0.3 | -0.1 | 0.7 | 0.150 |
| CS 4*height interaction^ | 0.4 | 0.1 | 0.7 | 0.014 |
| CS 4.5*height interaction^ | 0.7 | 0.3 | 1.1 | 0.000 |
| CS 5*height interaction^ | 0.9 | 0.3 | 1.6 | 0.005 |
| constant | 393.3 | 384.1 | 402.5 | 0.000 |
| Height (cm) | 2.0 to 2.5 | 2.5 to 3.0 | 3.0 to 3.5 | 3.5 to 4.0 | 4.0 to 4.5 | 4.5 to 5.0 |
| 120 | 10.1 | 16.4 | 2.6 | 5.1 | -0.5 | 12.8 |
| 140 | 6.7 | 11.1 | 8.4 | 7.1 | 5.7 | 17.3 |
| 160 | 3.2 | 5.9 | 14.2 | 9.1 | 11.9 | 21.7 |
Increments in bodyweight varied in a non-linear fashion with body condition score. For a 140cm tall horse, a change in condition score from 3 to 3.5 resulted in an estimated increase in bodyweight of 8.4kg. For the same horse gaining condition from CS 3 to CS 4 resulted in an estimated increase in body weight of 15.5kg. On the other hand losing condition from CS 3 to CS 2 in a 160cm high horse resulted in an estimated decrease in body weight of 9.1 kg.
Gaining condition (by half a condition score increments) in good to fat horses (CS > 3) was associated with greater weight gains in taller horses compared to smaller horses. On the other hand, losing condition required greater weight loss in smaller horses than in taller ones.
Supplements Fed
Only a summary of the supplement patterns fed is presented here to provide relevant context for the pasture data, with the remainder published elsewhere (Buckley, 2009)2. A reasonably consistent seasonal pattern of the daily contribution of supplements fed to digestible energy requirements of horses is depicted in Figure 4. The first winter showed an increase in feeding supplements during the month of August responsible for the spike observed in Figure 4, and there was a reduction in the supplements contributing to daily DE in the spring months. The winter months of June and July in Figure 4 contain data from both winter 1 (commencement) and winter 2 (conclusion) of the study. During 10 % (60 / 599) of horse-months, study horses received more than 100 % of their estimated daily digestible energy requirement from supplemental feed.
Figure 4.Seasonal pattern of the mean percentage contribution to daily digestible energy (DE) requirement by three categories of supplements (roughage, grain and concentrate) fed to 84 horses
Paddock Size and Stocking Rate
Paddock size and stocking rate data were available for 93% (671/720) of horse-months. Mean paddock size allocated to horses was 6.5ha, with a range of 0.03ha to 101ha. Study horses were mostly grazed with companion horses or other livestock (sheep, cattle and goats). Stocking rates at which study horses were grazed (accounting for study horses and other livestock sharing the available grazing area) varied substantially. The mean stocking rate was one dry horse equivalent per 1.8 hectares or 0.6 dry horse equivalents per hectare, with a median of 1.1 dry horse equivalents per hectare.
Available Pasture Mass
Available pasture masses varied markedly between seasons. Pasture mass was greatest in the spring and summer months, followed by autumn and winter 1 and winter 2 (Table 5). Horses on one property had access to irrigated pastures and these horse-months are included in these results.
Table 5. Available pasture masses (kgDM/ha) in winter 1, spring, summer, autumn, and winter 2 for pastures grazed by 84 Pony Club horses during 658 horse-months| Season | Mean | Standard Deviation | Minimum | 1st Quartile | Median | 3rd Quartile | Maximum | Number of horse-months |
| Winter 1 | 1184 | 669 | 219 | 798 | 1068 | 1400 | 3938 | 139 |
| Spring | 1787 | 1004 | 0 | 1152 | 1624 | 2470 | 5426 | 163 |
| Summer | 1795 | 1217 | 0 | 743 | 1683 | 2776 | 5304 | 144 |
| Autumn | 1219 | 1049 | 0 | 302 | 976 | 1624 | 4625 | 169 |
| Winter 2 | 965 | 782 | 0 | 250 | 919 | 1232 | 2843 | 43 |
For some horse-months, horses at pasture had minimal pasture intake due to absence of herbage. For eleven percent of horse-months (74/653) the pasture was 75% to 100% bare.
Pasture Composition
Data for pasture composition (grass, clover, weed, dead, bare – as percentages of paddock by area covered) were collected for 653 horse-months. Overall, grass was the most common pasture category and clover the least, with median contributions to pasture composition (% of paddock area covered) of grass 25% and clover 5%. Weeds constituted greater than half the available grazing area for 7% (44/653) of horse-months; conversely, no weeds were recorded for 9% (59/653) of horse-months. Bare ground did not account for the absence of weeds in these horse-months, with values for bare ground ranging from 0% up to 100% and only 7 horse-months recording 100% bare ground. Median percentages of grass and clover were lowest over the summer months, when bare ground and dead matter percentages were highest.
Pasture Access
During 66.9 % (416 / 622) of horse-months, horses spent 24 hours / day at pasture. For 14.0 % (87 / 622) of horse-months, horses spent between eight and 12 hours each day at pasture. For 5.8 % (36 / 622) of horse-months, horses did not spend any time at pasture (Figure 5).
Figure 5.Frequency distribution of number of hours 84 Pony Club horses spent in a stable each day for 622 horse-months
Discussion
All study horses had access to pasture for part or all of each day throughout the 13 months of the study in a temperate climatic zone experiencing winter rainfall and relatively dry summers. Observed mean monthly rainfall during the study period was above the long term average, combined with mean daily temperatures close to long term averages.
Our results show that stocking rates, pasture mass and pasture composition vary greatly between horses and over time. Whilst seasonal pasture growth variations commonly occur in a temperate climate such as this, the seasonal variations in body weight and condition scores closely matched the pasture growth curves of horses grazing these pastures. This was unexpected, given that these horses also received supplementary feeding.
Body Condition Score and Bodyweight
In a previous study examining perceptions on horse health and performance, (Buckley et al., 2004) 4 owners reported that a healthy horse was neither too fat nor too skinny. Despite this, and given the large variations in observed body condition scores among study horses, it appears that owners are not achieving to maintain their horses in ideal body condition. Body condition score represents a cost effective, practical tool for monitoring horse health, but guidelines for ideal values in Pony Club horses have not been developed. Furthermore, the quantification of a condition score in kilograms of bodyweight to our knowledge has not been previously described for horses and should facilitate improved management of horse health.
The relationship of bodyweight with condition score was significant but body weight did not increase in a linear fashion with each increment in condition score. Measurements of body fat were not undertaken, and it cannot be ruled out that these may increase in a linear fashion with body condition score. Based on these data, body condition score ought to be used as a categorical variable when modelling any association of body weight with body condition score.
Body condition score was also significantly associated with horse height. We found that taller horses required more weight gain (kg) to gain the same condition as smaller horses. Conversely, smaller horses required more bodyweight loss to lose the same condition as taller horses. In other words, a gain in condition is worth more kilograms in taller horses, whereas a loss in condition is worth more in smaller horses. Some caution must be exercised when interpreting these results. The number of horses with low condition scores was small and may affect results for low body condition scores. It unlikely that the change in investigator one month into summer influenced the results, as the seasonal curve matches that of bodyweight index very closely. Furthermore, both investigators referred to the visual guide presented in section 5.3 to minimise misclassification bias when assessing body condition score at each visit.
Changes in body condition score were a good predictor of changes in bodyweight, based on their matching seasonal curves. Substantial within-horse variation in body weight and body condition score occurred in study horses. The median condition score of all study horses in any one month was never below three. However, for half of the horse-months, scores were 3.5 or higher, which is above the recommended scores of 2.5 to 3.5, for race horse (Carroll and Huntington, 1988)6 Adapting supplemental feed use to seasonal variations in pasture mass would be expected to reduce the fluctuations in body weight and condition score with consequent benefits of improved horse health and reduced feed costs. Mean seasonal bodyweight and body condition score followed the mean pasture mass curve reasonably closely. This suggests that pasture intake fluctuated with available pasture mass and accounted for much of the seasonal changes of bodyweight and body condition score in study horses. It follows that supplementary feeding practices when pasture mass was low were not sufficient to prevent body condition loss over these periods and that owners fed excessively in periods of high pasture intakes.
Despite seasonal fluctuations, study horses in general tended to be in good to fat body condition. This has important implications as risks of obesity-related diseases are likely to be increased in populations such as the study population due to excessive body condition. It also indicates that the use of supplements was largely unnecessary, except to prevent excessively thin body condition. It is interesting to note, that seasonal fluctuations in body condition have been reported in Prezewalski horses in Austria, kept in a three square kilometre enclosure under natural conditions without being offered supplements (Kuntz et al., 2006)14. In these horses, visually assessed body condition scores were at their lowest after the winter fast and peaking in autumn, following a seasonal pattern similar to that of dry matter intake. However, the body condition scores in these wild horses ranged from 1 to 3 (on a scale of 1 to 5, with 1 being very thin and 5 being obese), and no horse was in the obese range. Furthermore, laminitis or other disease conditions were not observed in this cohort of wild horses. In contrast, the prevalence of acute laminitis in the current study was higher than that reported in America, peaking at 4.9 % in September, the first spring month in Australia (Buckley, 2009)2. The apparent lack of obesity in wild horses is in stark contrast to its prevalence in Pony Club horses, and may reflect higher exercise levels or effort spent browsing for maintenance in wild horses.
Obesity has been implicated as a risk factor for several important diseases in horses including laminitis, equine metabolic syndrome, equine hyperlipaemia, pituitary pars intermedia dysfunction, and insulin insensitivity (MacLeay, 2002)17. Equine metabolic syndrome is a condition that has been linked to obesity-linked laminitis in aged horses and ponies (Messer, 2006)22. Both obesity and laminitis were reported in the current study (Buckley, 2009)2. There is growing evidence that insulin resistance plays a role in equine laminitis (McGowan et al., 2007)19, and that there are complex metabolic interactions between several of the aforementioned syndromes in horses possibly genetically at risk of developing obesity. It has been theorized that specific fat deposits in ponies, including the cresty neck, may in fact represent metabolically active adipose tissue, providing endocrine signals that disrupt the glucose and insulin signalling (Treiber et al., 2006)23. Although, study horses were not examined for metabolic disorders, hirsutism (unusually long and wavy hair coat, which fails to shed normally in the warm seasons, and which is believed to be pathognomonic for pituitary pars intermedia dysfunction) was not observed.
Observed sharp rises in spring were followed by a more gradual decline to the next winter, suggest that seasonal pasture fluctuations were not well managed to maintain healthy horse body conditions, nor was body condition scoring used to manage horse access to pasture.
Stocking Rate
Horses require a minimum area of paddock to engage in the full spectrum of normal activities, including foraging, exercising and socializing (Jorgensen and Boe, 2007)12. This area has been suggested as 1.5 ha for a single horse (Kusonose, 1985)15. In the current study, horses mostly grazed paddocks larger than three hectares. However, for a proportion of the horse population (~20% of horse-months), horses were kept in paddocks much smaller than 1.5 ha, and in some horse-months (6%), horses were denied any paddock access and these animals may be at risk of health and behaviour problems as a consequence of confinement. The amount of self-exercise a horse undertakes in the paddock is a function of paddock size (Hampson and Pollitt, 2011)9, and horses in unrestricted grazing situations, such as feral brumbies, will travel up to 17.9km/d compared to horses in a 6x6m2 yard enclosure, that travel only 1.1km/d. Therefore, horses in small enclosures are at risk of both under exercising and over or under feeding, and must be carefully monitored.
Pasture Mass
Horses are efficient browsers and their voluntary food intake exerts a greater influence on the feeding value of pasture than the actual quality of the pasture (Hoskin and Gee, 2004)10. Furthermore, body condition score impacts on appetite, and obese horses in one study had lower appetites and weight gain than non-obese animals (Dugdale et al., 2011)7. Despite anecdotal evidence of a ‘hard cresty neck’ (rapid fat deposition tightening skin) being a greater risk for laminitis than a ‘soft cresty neck’, it is unclear whether the risk for obesity related disease is at all a function of the rate of fat deposition. Furthermore, in addition to risking metabolic disease, recent evidence suggests that fat and obese horses with access to green pasture or fed supplements on a daily basis also are at greater odds of misbehaving (Buckley et al., 2013)5. Pasture mass was assessed to provide an estimate of pasture availability to grazing horses. On unrestricted pasture access, grazing pony mares voluntarily consumed up to 4.5% of their bodyweight as dry matter in a day (Dugdale et al., 2011)7, indicating that horses’ grazing behaviour varies and cannot be relied upon to impose its own healthy grazing restrictions. Pony Club horses represented a diverse cohort of horses and ponies, who generally exercise infrequently and at low levels of intensity (Buckley, 2009)2. They would, therefore, have an estimated digestible energy requirement a little above maintenance. Study horses grazed temperate pastures with mean dry matter content similar to pastures in south Queensland (Gallagher, 1996, Martin, 1993, McMeniman, 1996)8,18,21, yielding a range of energy contents (7.6-11.8MJ/kgDM). Given unrestricted pasture access, such pastures could meet Pony Club horses’ energy requirements, but unrestricted grazing also risks excess energy intake. There appears to be a need to carefully match horses’ daily energy intake with their energy expenditure, including self-exercise in the paddock, and exercise while being ridden or lunged.
Pasture Composition
Optimal composition allows greater reliance on pasture as a balanced nutrient source for horses, and reduces costs associated with supplemental feeds. However, resultant advantages must be weighed against risks for pasture-related horse health (Watts, 2005, Watts, 2010)24,26and behaviour problems (Buckley et al., 2013)5 Of the five pasture categories (grass, clover, weed, dead matter and bare) measured, grass was the most common pasture plant present, with the clover component often being the lowest, particularly in summer-autumn. Values of clover ground cover exceeding 10%, have been associated with increased risk of misbehaviour in ridden horses (Buckley et al., 2013)5, but this threshold is lower than 20-30% clover recommended for an ideal pasture for horses (Avery, 1997)1. Study horses often avoided eating weeds leaving large areas of paddocks effectively ungrazed, increasing the effective stocking rate and resultant grazing pressure. Presence of weeds and bare ground in study pastures provided evidence of varying degrees of pasture decline. Better pasture management could reduce grazing pressures and prevent pasture degradation (Kelleher, 1997)13, and reduce health risks (Watts, 2010)24. It is not clear what motivates feeding decisions, however, managing pastures, while at the same time minimising the observed unhealthy weight gains, appears to be a major challenge facing owners of Pony Club horses.
Conclusions
Whilst pasture must be considered a key player in horse health, those in this study were not managed to achieve either healthy horse body condition scores or to prevent pasture degradation. Body condition score increases and decreases were quantified in kilograms. Results suggest that changes in body condition score did not follow a linear pattern. This study highlights a need to consider pasture management to optimise pasture quality, while at the same time minimising unhealthy weight gains. Educating the owners of Pony Club horses about body condition scoring might help prevent observed seasonal fluctuations in body weight, but additional advice is necessary to guide pasture and grazing management. Whilst the ideal pasture composition to deliver healthy nutrition for Pony Club horses is not known, it is likely to differ to that ideal for broodmares and other livestock because of differing energy demands and unique health risks. Based on estimated horse energy demands, well-managed pasture use could reduce supplement feed costs whilst also meeting the energy requirements of Pony Club horses. Achieving and maintaining healthy body condition in Pony Club horses is an additional challenge for horse owners requiring further grazing management not currently practiced.
Acknowledgements
We thank participating Pony Clubs, The University of Queensland, Charles Sturt University, Rural Industries and Development Corporation, and Professor Ted Wolfe.
References
- 2.BUCKLEY P. (2009) Epidemiological studies of health and performance of Pony Club horses.PhD thesis,University of Queensland. , Australia.[Online],http://espace.library.uq.edu.au/view/UQ: 179306.
- 3.BUCKLEY P, BUCKLEY D, COLEMAN G, MORTON J. (2016) Preventive health care of Pony Club horses in rural New South Wales, Australia.Australian Veterinary Journal,94,265-270.
- 4.BUCKLEY P, DUNN T, S J MORE. (2004) Owners’ perceptions of the health and performance of Pony Club horses in Australia.Preventive Veterinary Medicine,63,121-133.
- 5.BUCKLEY P, J M MORTON, D J BUCKLEY, G T COLEMAN. (2013) . Misbehaviour in Pony Club horses: Incidence and risk factors.Equine Veterinary Journal,45,9-14 .
- 6.CARROLL C L, P J HUNTINGTON. (1988) Body condition scoring and weight estimation of horses.Equine Veterinary Journal,20,41-45.
- 7.DUGDALE A H A, G C CURTIS, CRIPPS P J, HARRIS P A, ARGO C M. (2011) Effects of season and body condition on appetite, body mass and body composition in ad libitum fed pony mares.The Veterinary Journal,190,329-337.
- 8.GALLAGHER J. (1996) The potential of pasture to supply the nutritional requirements of grazing horses.Australian Veterinary Journal,73,67-68.
- 9.B A HAMPSON, POLLITT C C. (2011) Improving the foot health of the domestic horse. Rural Industries Research and Development Corporation.
- 10.HOSKIN S O, GEE E K. (2004) Feeding value of pastures for horses.New Zealand Veterinary Journal,52,332-341.
- 11.W F HUNT. (1997) Pastures for horses: A New Zealand perspective.Proceedings of the equine nutrition and pastures forhorsesworkshop,RIRDC Research Paper No. 97/3
- 12.JORGENSEN G H M, K E BOE. (2007) A note on the effect of daily exercise and paddock size on the behaviour of domestic horses (Equus caballus).Applied Animal Behaviour Science,107,166-173.
- 13.F M KELLEHER. (1997) Ecology and management of horse pastures.Proceedings of the equinenutiritonand pastures forhorsesworkshop,RIRDC. Research Paper No. 97/3
- 14.KUNTZ R, KUBALEK C, RUF T, TATARUCH F, ARNOLD W. (2006) Seasonal adjustment of energy budget in a large wild mammal, the Przewalski horse (Equus ferus przewalskii) I. Energy intake.Journal of Experimental Biology,209,4557-4565.
- 15.KUSONOSE R, HATAKEYAMA H, KUBO K, KIGUCHI A, ASAI Y et al. (1985) Behavioral studies on yearling horses in field environments. 1. Effects of field size on the behavior of horses.Japanese. , Bulletin of the Equine Research Institute,22,1-7
- 16.D L LITTLE, A B FRENSH. (1993) A rod-point technique for estimating the botanical composition of pastures.Australian. , Journal of Experimental Agriculture,33,871-875
- 17.J M MACLEAY. (2002) . Geriatric medicine.Veterinary Clinics of North America, Equine Practice,18 .
- 18.MARTIN R G. The University of Queensland (1993) Effects of nitrogen and energy supplementation on grazing broodmares and aspects of nitrogen metabolism in horses, PhD Thesis.
- 19.MCGOWAN C M, ASPLIN K, POLLITT C, SILLENCE M. (2007) Endocrinopathic laminitis in horses. Australian College of Veterinary Scientists: College Science Week Scientific Meeting. Gold coast International Hotel, Surfers , Paradise .
- 21.MCMENIMAN N P. (1996) Nutrition of grazing brood mares and growing horses.Australian Veterinary Journal,74,64-70.
- 22.N T MESSER. (2006) . Endocrine dysfuncction in the aged horse.In:BERTONE JJ. (ed.).EquineGeriatric Medicine and Surgery.St. Louis,Missouri:Saunders and Elsevier .
- 23.K H TREIBER, D S KRONFEL, T M HESS, B M, R K SPLAN et al. (2006) Evaluation of genetic and metabolic predispositions and nutritional risk factors for pasture-associated laminitis in ponies.Journal of the American Veterinary Medical Association,228,1538-1545.
- 24.WATTS K. (2010) Pasture Management to Minimize the Risk of Equine Laminitis.Veterinary Clinics of North America: Equine Practice,26,361-369.
Cited by (1)
- 1.Siede C., Komainda M., Tonn B., Wolter S.M.C., Schmitz A., et al, 2024, An inventory of grassland use on horse farms, Journal of Equine Veterinary Science, 134(), 105011, 10.1016/j.jevs.2024.105011