
Analysis of Clinical Prognostic Variables for Triple Negative Breast Cancer Histological Grading and Lymph Node Metastasis
Abstract
Background:
Triple Negative Breast Cancer (TNBC) is a type of breast cancer with very bad prognosis. Predicting the histological grade (HG) and the lymph nodes metastasis is crucial for developing more suitable treatment strategies.
Methods:
We present the main clinical and pathological variables to predict the histological grade and lymph nodes metastasis via novel machine learning techniques. These variables are currently being used for prognosis and treatment in medical practice. This analysis was performed using a database of 102 Caucasian women diagnosed with TNBC. The results were cross-validated using random simulations of this dataset.
Results:
HG was predicted with an accuracy of 93.8% using a list of 6 prognostic variables with significant implications: Ki67 expression, use of Oral contraceptives, Col11A1 expression, Col11A1 score, E-cad truncated and Tumor size. The lymph nodes metastasis was predicted with an accuracy of almost 85% using only 6 prognostic variables: Vascular invasion, Tumor size, Perineural invasion, Age at diagnosis, Ki67 expression, and Col11A1 score. This analysis also served to establish the median signatures of the groups with and without lymph node metastasis, and proved the existence of a kind of small-size tumors (around 2.15 cm) with lymph node metastasis but not showing vascular and perineural invasions and higher protein Col11A1 score. Besides, these signatures proved to be very stable.
Conclusions:
The additional information conveyed by the prognostic variables found in these two classification problems provides new insight about the genesis and progression of this disease and can be used in medical practice to improve decisions in patient diagnosis and further treatment.
Author Contributions
Academic Editor: Yu-Dong Zhang, University of Leicester, United Kingdom.
Checked for plagiarism: Yes
Review by: Single-blind
Copyright © 2018 Ana Cernea, et al.
 This is an open-access article distributed under the terms of the Creative Commons Attribution License, which permits unrestricted use, distribution, and reproduction in any medium, provided the original author and source are credited.
Competing interests
The authors have declared that no competing interests exist.
Citation:
Background
Breast cancer is a very heterogeneous disease. This term includes a variety of entities with distinct morphological features and clinical behaviors. For a long time, breast tumors have been classified according to their morphological features (histological type and grade) to ascertain prognostic outcome in patients. Subsequently, molecular markers were used to provide additional predictive power.
Triple Negative Breast Cancers (TNBC) refers to any breast cancer characterized by the absence of Estrogen Receptors (ER), Progesterone Receptors (PR) and Human Epidermal Growth factor 2 receptors (HER2). A correct classification of TNBC samples is important from a clinical and therapeutic point of view for deciding treatment strategies, since TNBC are resistant to targeted therapies 1, 2. Besides, statistical analyses have shown that TNBC accounts for approximately 15%-25%of all breast cancers 3. Recently, a molecular classification of tumors based on gene expression profiles was proposed 4 and served to define five different subtypes of breast cancer that were not previously detected using traditional histo-pathological methods 5. This classification includes the basal-like tumors group which are defined by one of the following conditions 6: (1) the lack of ER, PR, and HER2 expression; (2) the expression of one or more high-molecular-weight/basal cytokeratins (CK5/6, CK14); (3) the lack of expression of ER and HER2, in conjunction with the expression of CK5/6; and (4) the lack of expression of ER, PR, and HER2 in conjunction with the expression of CK5/6. Among these four cases two match with definition of TNBC. Also, from a morphological point of view basal-like and triple negative breast cancers share a predominance of high histological grades. The analysis of gene expression profiles showed a 77% overlap between TNBC and the intrinsic basal-like subtype, but TNBC also includes some special histological types such as medullary and adenoidcystic carcinoma with low risks of distant recurrence 2, 4, 7, 8.
The treatment options for TNBC are adjuvant chemotherapy and radiotherapy. Unfortunately, response to chemotherapy does not correlate with overall survival. In addition, recurrences are observed in TNBC during the first and third years after treatment, and most deaths take place in the first five years. The survival decreases after the first distant metastatic event 9. Therefore, in this heterogeneous group of tumors, new identification and classification techniques are necessary to better predict diagnosis and prognosis in order to establish appropriate therapies and improve patient survival 10.
The histological grade (HG) of the TNBC samples is used to decide the treatment, and it is commonly established according to the Nottingham Histological Score system (the Elston-Ellis modification of Scarff-Bloom-Richardson grading system) 11, 12, 13. This system is based on the ability of the tumor to form structures similar to the ducts where the tumor is originated, on the similarity between the cancer cells and the original benign cells, and finally on their proliferating activity. The cells and tissue structure of breast cancer are histopathologically examined to determine how aggressive the cancer is. Lower grade tumors with a better prognosis can be treated less aggressively and have a better survival rate. Higher grade tumors are treated more aggressively causing adverse effects due to more aggressive medications. Therefore, the histological grade assignment plays important role in deciding treatment options of TNBC and also in prognosis. The main variables involved in this grading system are Mitotic count, Nuclear Pleomorphism, and Tubule Formation. The Mitotic count score depends on the field diameter of the microscope used by the pathologist. In the present case, it was established by counting how many mitotic figures are seen in 10 high power fields 14, 15. The Nuclear Pleomorphism score increases with the variation of size and shape of cells, from small nuclei to larger cells with vesicular nuclei 16. Finally, the Tubule formation decreases with the percentage of tumor area forming glandular/tubular structures 17.
The aim of this research is to provide the main pathological and immuno-histochemical variables that have the greatest predictive accuracy for the most aggressive TNBC histological grades 2 and 3 (named HG2 and HG3) and of lymph nodes metastasis. For that we have used a cohort of 102 Caucasian women diagnosed at Hospital Universitario Central de Asturias (Spain) with TNBC, 96 of them with prescribed histological grade, and 72 of them controlled for lymph nodes metastasis.
The methodology used in this paper is based on machine learning techniques and have been successfully previously applied in the prediction of treatment response in Hodgkin Lymphoma 18 and in addressing different Chronic Lymphocytic Leukemia decision-making problems 19 using clinical data. In the present case, the histological grade was predicted with a leave-out-one-cross-validation (LOOCV) accuracy of almost 64 and the lymph node metastasis with that of 84%. Besides, we provide analysis of the confusion matrix corresponding to the optimum classifier and different associations of prognostic variables with high predictive accuracy that serve to appraise the uncertainty of the corresponding prediction problems and to better understand the genesis of this disease 20, 21.
Methods
The methodology presented here aims at assessing the histological grade of new TNBC incoming samples and understanding the main prognostic variables involved in lymph nodes metastasis. The aim of this analysis is also to provide clinicians with expert systems to assist medical decisions.
Dataset description
A cohort of 102 Caucasian women diagnosed in Hospital Universitario Central de Asturias (Oviedo, Spain), with TNBC and ages between 30 and 94 years were enrolled in this study, which was developed in accordance with the Helsinki Declaration of 1975. This study was approved by the ethics committee (IRB approval 193/17) with the patient informed consent. Tumor samples were obtained from surgical resection. Samples were fixed in 10% formaldehyde and paraffin embedded, then cut 4μm thick, mounted on treated slides, and stained with Hematoxylin and Eosin (H&E) stain. Finally, these sections were studied and photographed at two different resolutions (100X and 400X) using an Olympus light microscope. Most of the cancers in this cohort were classified as histological grades 2 and 3. The clinical and pathological characteristics of the cohort are provided in the supplementary material (Table 1 and Table 2). The survival time in this cohort has a median of 40 weeks and lower and upper quartiles of 25 and 61 weeks respectively.
Table 1. Clinic-pathological characteristics of 102 analyzed patients with TNBC. Binary values coded as follows: Negative=0, Positive=1. Unknown values are interpolated.| Variable | Category | Number | Percentage (%) |
| Age(Mean = 59, Min=30, Max = 94) | ≤59 | 54 | 52.90 |
| >59 | 48 | 47.10 | |
| Tumor size | ≤ 2.1 | 57 | 55.88 |
| >2.1 | 45 | 44.12 | |
| Histological grade | Grade 1 | 2 | 1.96 |
| Grade 2 | 19 | 18.63 | |
| Grade 3 | 75 | 73.53 | |
| Unknown | 6 | 5.88 | |
| N | Negative nodes | 45 | 44.12 |
| Positive nodes | 26 | 25.49 | |
| Unknown | 31 | 30.39 | |
| Vascular invasion | Negative | 80 | 78.43 |
| Positive | 22 | 21.57 | |
| Perineural invasion | Negative | 91 | 89.22 |
| Positive | 11 | 10.78 | |
| Lactation | Non lactation | 16 | 15.70 |
| Lactation | 45 | 44.10 | |
| Unknown | 41 | 40.20 | |
| Pregnancies | Non pregnancies | 17 | 16.70 |
| Pregnancies | 71 | 69.60 | |
| Unknown | 14 | 13.70 | |
| Family History BOE (Breast, Ovary and Endometrial cancer) | without B, O, E (0) | 38 | 37.30 |
| with B, O, E (1) | 34 | 33.30 | |
| Unknown | 30 | 29.40 | |
| Family History Cancer | without cancer (0) | 20 | 19.60 |
| with cancer (1) | 58 | 56.90 | |
| Unknown | 24 | 23.50 | |
| Oral contraceptives | Non oral contraceptives (0) | 29 | 28.40 |
| Oral contraceptives (1) | 27 | 26.50 | |
| Unknown | 46 | 45.10 | |
| Alcohol consumption | Non drinker (0) | 65 | 63.70 |
| Drinker (1) | 12 | 11.80 | |
| Unknown | 25 | 24.50 | |
| Tobacco consumption | Non smoker (0) | 46 | 45.10 |
| Smoker (1) | 32 | 31.40 | |
| Unknown | 24 | 23.50 |
The TNBC samples are categorized into HG2 when the total score falls between 6 and 7 points and HG3 when it falls between 8 and 9. In our database, 75% of the samples belong to the HG3 group (see Table 2). Besides, other variables used by the pathologists are the TNM stage that takes into consideration the Tumor size (T) and the presence of any lymph Nodes metastases (N) or distant organ Metastases (M); the Vascular and Perineural invasion that indicates the presence or absence of tumor cells inside the vessels and nerves, the Nipple and/or skin invasion, and also the Necrosis. The tumor size in our cohort varies between 0.1 and 6.5cm with a median size of 2 cm. Different immuno-histochemical variables were also monitored due to its importance in predicting TNBC prognosis and treatment response 22, 23, 24, 25, 26, 27, 28, 29: the hormone receptor status (ER, PR and Androgen Receptor-AR); HER2, Ki67, Bcl2, p53, CK5/6, CK14 and Col11A1 expressions.
Table 2. Pathological and immunohistochemical variables in the cohort of 102 women with TNBC.| Variable | Cathegory | Number of samples | Percentage (%) |
| Tubule formation | >75% of tumor | 73 | 71.57 |
| 10-75% of tumor | 20 | 19.61 | |
| < 10%of tumor | 3 | 2.94 | |
| unknown | 6 | 5.88 | |
| Nuclear Pleomorfism | moderate variation in size and shape | 6 | 5.88 |
| marked variation | 90 | 88.24 | |
| unknown | 6 | 5.88 | |
| Mitotic count | 0-8 mitotic counts | 13 | 12.75 |
| 8-16 mitotic counts | 17 | 16.67 | |
| over 16 mitotic counts | 66 | 64.71 | |
| unknown | 6 | 5.88 | |
| AR expression | Negative | 72 | 70.59 |
| Positive | 30 | 29.41 | |
| Ki67 expression | <20% | 11 | 10.78 |
| 20-50% | 31 | 30.39 | |
| >50% | 60 | 58.82 | |
| P53 expression | Negative | 29 | 28.43 |
| Positive | 73 | 71.57 | |
| Bcl2 expression | Negative | 50 | 49.02 |
| Weak | 33 | 32.35 | |
| Strong | 19 | 18.63 | |
| E-cadherin truncated in membrane | Non-truncated | 68 | 66.67 |
| Truncated | 34 | 33.33 | |
| Ck5/6 expression | Negative | 37 | 36.27 |
| Focal | 35 | 34.31 | |
| Diffuse | 30 | 29.41 | |
| Ck14 expression | Negative | 56 | 54.90 |
| Focal | 29 | 28.43 | |
| Diffuse | 17 | 16.67 | |
| Pro-Col11A1 expression | Low (<=1) | 54 | 52.94 |
| High (>1) | 48 | 47.06 |
Table 3 shows the list of all the clinical variables used in this study, together with their sampling frequency. It can be observed that all immuno-histochemical variables are sampled in100% of the samples. Variables with sample frequencies lower than 100 are imputed. Perineural invasion was the only pathological variable that needed to be imputed (sampled in 98% of the samples). In the case of clinical characteristics, Menopause is the only variable that has been determined on all samples. On the other hand, the Histological Grade (HG) and the lymph Nodes metastasis (N) will be used for the class assignment in the two-different machine learning classification problems that are analyzed in this paper.
Table 3. Clinical variables used in this analysis, and their sampling frequency.| Type | Variable Name | Freq. (%) |
| Pathological Variables | Histological Grading (HG) | 95.0 |
| Mitotic Count (MC) | 95.0 | |
| N | 70.0 | |
| Necrosis (Necr) | 100.0 | |
| Nuclear Pleomorphism (NP) | 95.0 | |
| Perineural Invasion (PI) | 98.0 | |
| Tubular Formation (TF) | 95.0 | |
| Tumor Size (TS) | 100.0 | |
| Vascular invasion (VI) | 100.0 | |
| Immunohistochemical Variables | AR expression (AR) | 100.0 |
| Bcl2 expression (Bcl2) | 100.0 | |
| CK14 expression (ck14) | 100.0 | |
| CK5/6 expression (ck5/6) | 100.0 | |
| Col11A1 expression (ColE) | 100.0 | |
| Col11A1 intensity (ColI) | 100.0 | |
| Col11A1 score (ColS) | 100.0 | |
| ER expression (ER) | 100.0 | |
| HER2 expression (HER2) | 100.0 | |
| Ki67 expression (Ki67) | 100.0 | |
| p53 expression (p53) | 100.0 | |
| PR expression (PR) | 100.0 | |
| Clinical Characteristic | Age at diagnosis | 100.0 |
| Age at Menarche | 79.4 | |
| Age First Child | 35.3 | |
| Lactation | 59.8 | |
| Pregnancies | 86.3 | |
| Familiar History BOE | 70.6 | |
| Family History Cancer | 76.5 | |
| Oral contraceptives | 54.9 | |
| Alcohol consumption | 75.5 | |
| Tobacco consumption | 76.5 | |
| Menopause | 100.0 |
Machine learning methodology
The machine learning methodology used in this paper is described in Figure 1. The first step consists in pre-processing the database and reading the different clinical variables of the samples that are involved in the class assignment for the different classification problems (histological grade and lymph nodes metastasis). Samples with missing values are imputed using a nearest-neighbor interpolation algorithm 18, 19.
Figure 1.Flow chart of the novel machine learning methodology used in this paper.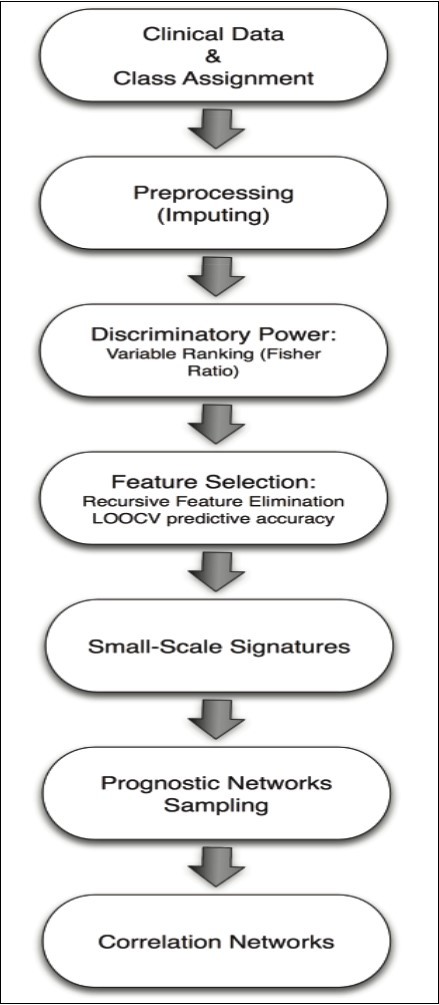
The discriminatory power of the different variables is established according to their Fisher’s Ratio (FR). In a binary classification, the Fisher’s ratio of the attriute j is defined as:
where μji is a measure of the center of mass of the probability distribution of the attribute j in class i, and σji is a measure of its dispersion within this class. Discriminatory attributes correspond to higher Fisher’s ratios since they have a low intra-class dispersion (intra-class homogeneity) and high inter-class distance that accounts for the separation between the centers of the corresponding prognostic variable distributions.
The algorithm used for prediction and finding the minimum-size list of prognostic variables is composed of 4 steps.
The first one is the variable ranking and selection. Attributes are ranked decreasingly according to their Fisher’s ratio values. The attribute with the highest score is the main prognostic variable for the class discrimination. The algorithm finds the minimum size list of prognostic variables with the optimum accuracy by adding iteratively attributes with smaller Fisher’s ratios in order to span high frequency details of the class discrimination 30, 31, 32. The set with the optimum accuracy and minimum size is therefore selected. The accuracy of the different lists is based on Leave-One-Out Cross-Validation (LOOCV) via a simple distance-based classifier built with the reduced set of discriminatory variables 18, 19. LOOCV is a well-established method in which a single sample from the original dataset serves as the validation data (sample test), and the remaining samples as training data. The class assignment is based on a nearest-neighbor classifier in the reduced base, that is, the class with the minimum distance in the reduced base to the sample test is assigned to the sample test. The average LOOCV predictive accuracy is calculated by iterating over all the samples. This algorithm serves to find the Small-Scale Signature with the highest LOOCV predictive accuracy, which provides an estimation of the predictive accuracy of new incoming samples.
The second step is the Random sampling of prognostic networks to find other different networks of highly discriminatory prognostic variables. The existence of these networks has been explored in 20, 21. The prior sampling probability of a prognostic variable is considered to be proportional to its Fisher’s ratio. That way the most discriminatory variables are preferentially sampled. After the sampling has been accomplished, the most discriminatory networks are determined, and the posterior sampling frequencies of the main prognostic variables involved in these networks are analyzed.
The third step is the Stability and ROC Analysis. The stability of these signatures is also examined by random 75/25 (75% of samples used for training and 25% for validation) hold-out experiments. The aim of the hold-out procedure is two-fold checking the stability of the predictive accuracy of the small-scales signatures found via LOOCV when the number of training samples is decreased. In this case, the minimum-scale signature is read in the training data set for building the nearest-neighbor classifier and it is applied to establish the small-scale signature predictive accuracy in the validation set. The cumulative distribution function of the small-scale predictive accuracies found in different hold-outs is finally presented and serves to account for the variability in its predictive accuracy with partial information. A statistical analysis is performed providing theinter-quartile, standard deviation, mean and median bounds that could be expected in an independent dataset. These cross-validation techniques serve to take into account the effect of the limited size of the biomedical datasets used for training and validation, in order to predict how these signatures would generalize for new incoming samples, since in real problems it is very difficult to find a database with a similar design, to perform an independent validation of the results. In the ROC analysis (see for instance Park et al, 2004) 33. We provide various metrics of the diagnostic ability of the most predictive signatures derived from the confusion matrix: sensitivity (true positive rate or the probability of detection) and specificity (true negative rate). Finally, the correlation network is built using the minimum spanning tree via Kruskal’s algorithm 34 and the Pearson Correlation coefficient among the most discriminatory variables. The weights of this connected graph are the correlation coefficients between the corresponding prognostic variables. The head of the tree is the most discriminatory variable of the corresponding classification problem, whereas the branches contain the variables that are weakly correlated to the headers. The analysis of the correlation networks between prognostic variables might be of help for the physicians to understand the genesis of the disease.
The implicit idea behind this algorithm is that the classification problem becomes linearly separable when the most discriminatory prognostic variables are selected 35, 37. This is a powerful idea based on the principle of parsimony, which should be used in all disciplines. Besides, when these accuracies are low, other nonlinear classification algorithms (black-box models) should be used instead. If despite all these trials, no improvement in the accuracy is observed, then the data set (data and class) is noisy or that the variables do not convey enough information to answer the proposed question 20, 21.
Results
Histological Grade Prediction
The aim of this analysis is to establish the discriminatory power of the immuno-histochemical, pathological and clinical variables for HG prediction. For that purpose, we did not use any of the three pathological variables involved in the Scarff-Bloom-Richardson definition: Mitotic count, Nuclear pleomorphism and Tubule formation. This analysis established the optimum variables networks for the HG prediction, and showed how the clinical and pathological variables influence the disease development, particularly the patients’ daily habits (oral contraceptives intake, tobacco smoking (or tobacco consumption) and alcohol consumption). We had at disposal the histological grade of 96 TNBC samples: 21 samples in HG2 and 75 samples in HG3.
The variables used in this classification problem are presented in Table 4, ranked by their discriminatory power given by their Fisher’s ratios in decreasing order. The maximum Fisher’s ratio (FR) is 1.28 and corresponds to Ki67 expression, followed by AR expression with a Fisher’s ratio of 1.03, and Oral contraceptives with 0.50. The rest of the variables have a lower FR and can only expand high frequency details of the classification problem 37. In this case, using the most discriminatory variable (Ki67 expression) we have obtained a LOCCV predictive accuracy of 72.9%. The accuracy has increased to 81.3by adding the second discriminatory variable (AR expression), and up to 85.4% by adding Oral contraceptives. The maximum accuracy (90.6%) is obtained using the list containing the8 first prognostic variables, which is the minimum-size list in this case. This table also shows their mean and standard deviation within each class (HG2 and HG3) and the LOOCV predictive accuracies of the corresponding ranked lists of prognostic variables, as explained in the machine learning algorithm description, and the minimum-size signature with the highest predictive accuracy. Fisher’s ratio can be interpreted as a prior discriminatory power of the variables considered individually, while the LOOCV accuracy is the posterior discriminatory power of these variables working in synergy.
Table 4. Histological grade (HG) prediction: ranked list of prognostic variables according to their Fisher ratio. C1 and C2 stand for the two classes of histological grades, HG2 and HG3, respectively. Bold faces show the maximum mean values of the variables in each group.| Variable | MeanHG2 | StdHG2 | MeanHG3 | StdHG3 | FR | Accuracy (%) |
| Ki67 expression | 1.67 | 0.80 | 2.71 | 0.46 | 1.28 | 72.9 |
| AR expression | 0.76 | 0.44 | 0.17 | 0.38 | 1.03 | 81.2 |
| Oral contraceptives | 0.00 | 0.00 | 0.33 | 0.47 | 0.50 | 85.4 |
| Bcl2 expression | 0.29 | 0.64 | 0.80 | 0.77 | 0.26 | 84.4 |
| CK14 expression | 0.24 | 0.54 | 0.72 | 0.78 | 0.26 | 82.3 |
| Col11A1 score | 1.33 | 1.71 | 2.73 | 2.50 | 0.21 | 84.4 |
| Col11A1 intensity | 0.67 | 0.73 | 1.16 | 0.84 | 0.20 | 84.4 |
| E-cad truncated | 0.14 | 0.36 | 0.41 | 0.50 | 0.20 | 90.6 |
| Age at diagnosis | 66.57 | 13.80 | 57.69 | 14.64 | 0.19 | 79.2 |
| Tumor Size | 1.65 | 0.92 | 2.32 | 1.34 | 0.17 | 81.3 |
| Col11A1 expression | 1.00 | 1.10 | 1.56 | 1.21 | 0.12 | 80.2 |
| Lactation | 0.95 | 0.22 | 0.80 | 0.40 | 0.11 | 79.2 |
| Necrosis | 1.00 | 0.84 | 1.37 | 0.78 | 0.11 | 80.2 |
| Pregnancies | 2.29 | 1.42 | 1.71 | 1.10 | 0.10 | 78.1 |
| Tobacco Smoking | 0.19 | 0.40 | 0.36 | 0.48 | 0.07 | 78.1 |
| Perineural invasion | 0.05 | 0.22 | 0.13 | 0.34 | 0.04 | 78.1 |
| Age at Menarche | 12.90 | 1.26 | 12.53 | 1.47 | 0.04 | 76.0 |
| Vascular invasion | 0.14 | 0.36 | 0.23 | 0.42 | 0.02 | 77.1 |
| Family History (BOE) | 0.71 | 0.46 | 0.61 | 0.49 | 0.02 | 78.1 |
| CK5/6 expression | 0.81 | 0.75 | 0.95 | 0.82 | 0.01 | 79.2 |
| N | 0.24 | 0.44 | 0.31 | 0.49 | 0.01 | 77.1 |
| Alcohol consumption | 0.10 | 0.30 | 0.12 | 0.33 | <0.01 | 77.1 |
| Age First Child | 25.10 | 3.11 | 24.95 | 3.39 | <0.01 | 76.0 |
| Menopause | 0.95 | 0.22 | 0.95 | 0.23 | <0.01 | 76.0 |
| p53 expression | 0.71 | 0.46 | 0.72 | 0.45 | <0.01 | 77.0 |
| Family History (Cancer) | 0.81 | 0.40 | 0.81 | 0.39 | <0.01 | 75.0 |
Table 5 shows the optimum classifier found by the random sampler with an accuracy of 93.8% using a list of only 6 prognostic variables: Ki67 expression, Oral contraceptives, Col11A1 score, E-cad truncated, Tumor Size, and Col11A1 expression and other networks of high discriminatory prognostic variables with a LOOCV predictive accuracy higher than 92%, together with their corresponding stability analysis and ROC analysis. Besides, these high predictive classifiers are very stable, with median accuracies of 91.7% and mean accuracies slightly lower, a low inter-quartile range (8.3) and the standard deviation (5.5) of the predictive accuracy. Subsequently, the ROC analysis shows a very high sensitivity (97%) and specificity (76%).
Table 5. HG prediction. Other high discriminatory networks with LOOCV predictive accuracies higher than 92% with their corresponding stability and ROC analysis.| Accuracy 93.8 % | Accuracy 92.7 % | ||
| Ki67 expression | Ki67 expression | Ki67 expression | |
| Oral contraceptives | Oral contraceptives | Oral contraceptives | |
| Col11A1 score | Age at diagnosis | E-cad truncated | |
| E-cad truncated | Tumor Size | Tumor Size | |
| Tumor Size | Perineural Inv. | Col11A1 expression | |
| Col11A1 expression | p53 expression | ||
| Classifier's stability (%) | |||
| Median | 91.7 | 91.7 | 91.7 |
| Mean | 91.6 | 90.2 | 89.7 |
| IQR | 8.3 | 8.3 | 4.2 |
| Std | 5.5 | 5.7 | 5.6 |
| ROC analysis (%) | |||
| Sensitivity | 97 | 96 | 96 |
| Specificity | 76 | 81 | 76 |
Besides, we provide a simple linear regression formula to perform a fast and useful estimation of the histological grading:
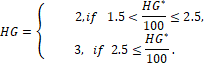
This regression formula has a low RMS error of 0.2, that is, estimated histological grades lower than 23 belong almost surely to HG2. This method complements the HG assessment provided by the Nottingham grading system in appraising this important decision problem concerning the patient treatment and prognosis.
Table 6 shows the main statistical results (median, mean, interquartile range, and standard deviation) of each predictive variables of the optimum classifier, calculated in the different groups of the confusion matrix (TP, TN, FP, and FN). The confusion matrix corresponding to the optimum classifier is
Table 6. HG prediction. Median, mean, IQR, and standard deviation of the signatures of the most predictive variables in the different groups of the confusion matrix (TP, FP, TN and FN).| -434340317881000Optimum Signature | TP | TN | FP | FN | ||||||||||||
| med | mean | IQR | std | med | mean | IQR | std | med | mean | IQR | std | med | mean | IQR | std | |
| Ki67 expression | 3.00 | 2.71 | 1.00 | 0.46 | 1.00 | 1.44 | 1.00 | 0.72 | 2.00 | 2.40 | 1.00 | 0.55 | 2.50 | 2.50 | 1.00 | 0.70 |
| Oral contraceptives | 0.00 | 0.34 | 1.00 | 0.48 | 0.00 | 0.00 | 0.00 | 0.00 | 0.00 | 0.00 | 0.00 | 0.00 | 0.00 | 0.00 | 0.00 | 0.00 |
| Col11A1 score | 2.00 | 2.77 | 6.00 | 2.51 | 0.50 | 1.12 | 2.00 | 1.41 | 1.00 | 2.00 | 3.75 | 2.55 | 1.50 | 1.50 | 3.00 | 2.12 |
| E-cad truncated | 0.00 | 0.42 | 1.00 | 0.50 | 0.00 | 0.06 | 0.00 | 0.25 | 0.00 | 0.40 | 1.00 | 0.55 | 0.00 | 0.00 | 0.00 | 0.00 |
| Tumor size | 2.10 | 2.29 | 1.60 | 1.34 | 1.50 | 1.68 | 1.60 | 0.95 | 1.00 | 1.54 | 1.07 | 0.92 | 3.35 | 3.35 | 0.30 | 0.21 |
| Col11A1 expression | 2.00 | 1.56 | 3.00 | 1.20 | 0.50 | 0.88 | 2.00 | 0.95 | 1.00 | 1.40 | 3.00 | 1.52 | 1.50 | 1.50 | 3.00 | 2.12 |
The samples of the TP group (HG3 correctly predicted) compared to the TN group (HG2 correctly predicted), present higher median Ki67 expression (3.0 vs 1.0), higher Col11A1 score and Col11A1 expression (2.0 vs 0.5) and higher tumor size (2.10 vs 1.50). Besides, all the samples with null Oral contraceptives intake fall in the TN group. On the other hand, the main differences between FP (samples with HG3 incorrectly assigned to HG2 class) and TP are: lower values of Ki67 (2.0 vs 3.0), no contraceptive intake for FP, lower ColA11 score and expression (1 vs 2) and Tumor size (1.0 vs 2.10). Finally, the comparison between TN and FN (samples in HG3 incorrectly predicted) shows higher Ki67 expression (1 vs 2.5), higher expression of the ColA11 protein (0.50 vs 1.5), and much higher tumor size in the FN group (1.50 cm vs 3.35 cm).
Figure 2 shows the correlation network for the HG prediction problem and serves to provide the relationships between the most discriminatory variables.
Figure 2.Histological Grade prediction. Correlation network among the most discriminatory prognostic variables.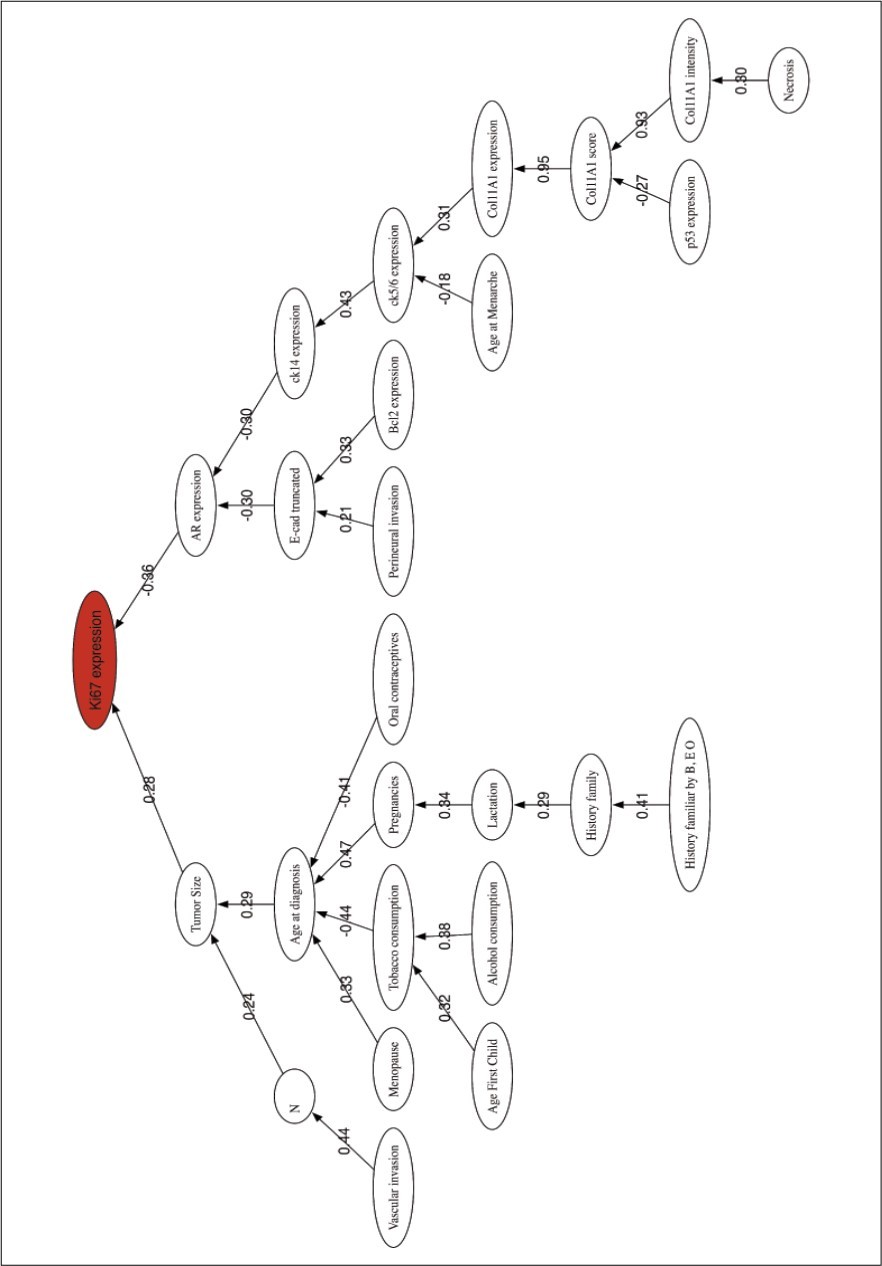
Lymph Nodes Metastasis Prediction
This classification problem tries to predict the presence or absence of lymph nodes metastasis, without making use of the HG variable, nor any of the pathological variables involved in the Nottingham score, and unraveling other prognostic variables at disposal that could be linked to this important problem in TNBC prognosis. In this case, we have at disposal 72 samples where 27 of them had one or two lymph nodes. Table 7 shows the information concerning the ranked lists of prognostic variables used in the lymph nodes metastasis prediction problem. The maximum Fisher’s ratio in the Lymph Nodes Metastasis prediction is 0.45 and corresponds to Vascular invasion, followed by Tumor Size (0.19), and Perineural invasion (0.14), meanwhile the rest of variables show a very low FR (close to zero). Due to these low Fisher’s ratios, it is expected that this classification problem will be harder in terms of achieving a high predictive accuracy. The maximum accuracy (75%) is provided by the Vascular invasion alone. Then, the LOOCV accuracy drops to 73.61% considering the list of the first seven most discriminatory variables: Vascular invasion, Tumor Size, Perineural invasion, Age First Child, CK14 expression, CK5/6 expression, and E-cad expression. This accuracy remains the same when we also add to the list the Family history.
Table 7. Lymph Nodes Metastasis prediction: ranked list of prognostic variables according to their Fisher ratio. C1 and C2 represent the two classes of metastasis prediction, C1: positive number of lymph nodes, C2: no lymph nodes.| Variable | MeanC1 | StdC1 | MeanC2 | StdC2 | FR | Accuracy |
| Vascular invasion | 0.48 | 0.51 | 0.09 | 0.29 | 0.45 | 75.0 |
| Tumor Size | 2.74 | 1.30 | 1.92 | 1.36 | 0.19 | 66.7 |
| Perineural invasion | 0.22 | 0.42 | 0.04 | 0.21 | 0.14 | 70.8 |
| Age First Child | 25.78 | 4.40 | 24.62 | 3.02 | 0.05 | 72.2 |
| ck14 expression | 0.78 | 0.75 | 0.58 | 0.72 | 0.04 | 69.4 |
| ck5/6 expression | 1.04 | 0.85 | 0.84 | 0.82 | 0.03 | 72.2 |
| E-cad expression | 1.00 | 0.00 | 0.98 | 0.15 | 0.02 | 73.6 |
| Family History Cancer | 0.89 | 0.32 | 0.82 | 0.39 | 0.02 | 73.6 |
| Tobacco consumption | 0.37 | 0.49 | 0.29 | 0.46 | 0.01 | 68.1 |
| Necrosis | 1.26 | 0.90 | 1.40 | 0.75 | 0.01 | 70.8 |
| Pregnancies | 1.93 | 1.27 | 2.11 | 0.98 | 0.01 | 65.3 |
| Age at diagnosis | 58.56 | 14.65 | 60.47 | 13.42 | 0.01 | 65.3 |
| Bcl2 expression | 0.63 | 0.74 | 0.73 | 0.81 | 0.01 | 63.9 |
| Age at Menarche | 12.48 | 1.28 | 12.62 | 1.25 | 0.01 | 66.7 |
| Col11A1 intensity | 0.89 | 0.85 | 0.96 | 0.82 | 0.00 | 65.3 |
| Ki67 expression | 2.56 | 0.70 | 2.51 | 0.63 | 0.00 | 65.3 |
| Lactation | 0.89 | 0.32 | 0.87 | 0.34 | 0.00 | 65.3 |
| Col11A1 expression | 1.26 | 1.23 | 1.20 | 1.10 | 0.00 | 65.3 |
| Family History BEO | 0.67 | 0.48 | 0.69 | 0.47 | 0.00 | 65.3 |
| E-cad truncated | 0.33 | 0.48 | 0.31 | 0.47 | 0.00 | 65.3 |
| Menopause | 0.96 | 0.19 | 0.96 | 0.21 | 0.00 | 65.3 |
| Col11A1 score | 2.04 | 2.38 | 1.96 | 2.15 | 0.00 | 62.3 |
| Alcohol consumption | 0.16 | 0.36 | 0.16 | 0.37 | 0.00 | 62.5 |
| AR expression | 0.26 | 0.45 | 0.27 | 0.45 | 0.00 | 62.5 |
| p53 expression | 0.70 | 0.47 | 0.71 | 0.46 | 0.00 | 62.53 |
| Oral contraceptives | 0.30 | 0.47 | 0.29 | 0.46 | 0.00 | 61.1 |
Table 8 presents the optimum classifier found by the random sampler with an accuracy of 84.72% using a list of seven variables: Vascular invasion, Tumor Size, Perineural invasion, Family history, Age at diagnosis, Ki67 expression, and Col11A1 score. We also present and other networks of high discriminatory prognostic variables with a LOOCV predictive accuracy higher than 83%. Their stability analysis shows that the median accuracies vary from 78% to 83.3%, the mean accuracies from 79% to 81.7%, the inter-quartile range from 5.5% to 11% and the standard deviation is around 5 to 8%. In addition, the ROC rates prove a good ability of diagnostic of all the classifiers with sensitivities between 78% and 81% and specificities between 84% and 89%.
Table 8. Lymph nodes metastasis prediction. Other high discriminatory networks of prognostic variables with predictive accuracies greater than 83% ad their respective stability and ROC analysis.| 666115230505000Acc. 84.7 % | Acc. 83.3% | |||
| Vascular Inv. | Vascular Inv. | Vascular Inv. | Vascular invasion | |
| Tumor Size | Tumor Size | Tumor Size | Tumor Size | |
| Perineural Inv. | Perineural Inv. | Perineural Inv. | Necrosis | |
| Family History Cancer | Necrosis | Necrosis | Col11A1 score | |
| Age at diagnosis | Age at diagnosis | Col11A1 score | Alcohol consumption | |
| Ki67 expression | Ki67 expression | AR expression | AR expression | |
| Col11A1 score | Col11A1 score | p53 expression | p53 expression | |
| Classifier's stability (%) | ||||
| med | 83.3 | 80.6 | 77.8 | 77.8 |
| mean | 80.6 | 80.4 | 79.3 | 79.5 |
| iqr | 7.6 | 5.6 | 11.1 | 11.1 |
| std | 5.6 | 7.1 | 7.4 | 7.9 |
| ROC analysis (%) | ||||
| Sensitivity | 78 | 81 | 78 | 81 |
| Specificity | 89 | 84 | 87 | 84 |
Table 9 shows the median, mean, interquartile range (IQR) and the standard deviation of the predictive variables of the optimum classifier in the different groups of the confusion matrix. The confusion matrix of the optimum classifier is:
Table 9. Lymph nodes metastasis prediction Median, mean, IQR, and standard deviation of the signatures of the most predictive variables in the different groups of the confusion matrix (TP, FP, TN and FN).| Optimum Signature | TP | TN | FP | FN | ||||||||||||
| med | mean | IQR | std | med | mean | IQR | std | med | mean | IQR | std | med | mean | IQR | std | |
| Vascular invasion | 1.00 | 0.57 | 1.00 | 0.50 | 0.00 | 0.07 | 0.00 | 0.26 | 0.00 | 0.20 | 0.25 | 0.44 | 0.00 | 1.17 | 0.00 | 0.40 |
| Tumor size | 3.00 | 2.85 | 0.97 | 1.35 | 1.50 | 1.89 | 1.55 | 1.30 | 1.50 | 2.22 | 1.50 | 1.90 | 2.15 | 2.35 | 0.60 | 1.09 |
| Perineural invasion | 0.00 | 0.28 | 1.00 | 0.46 | 0.00 | 0.05 | 0.00 | 0.22 | 0.00 | 0.00 | 0.00 | 0.00 | 0.00 | 0.00 | 0.00 | 0.00 |
| Family history | 1.00 | 0.95 | 0.00 | 0.21 | 1.00 | 0.80 | 0.00 | 0.40 | 1.00 | 1.00 | 0.00 | 0.00 | 1.00 | 0.67 | 1.00 | 0.51 |
| Age at diagnosis | 55.00 | 58.29 | 24.00 | 16.03 | 58.50 | 59.50 | 21.50 | 13.60 | 67.00 | 68.20 | 16.00 | 9.36 | 57.50 | 59.50 | 12.00 | 9.28 |
| Ki67 expression | 3.00 | 2.57 | 1.00 | 0.75 | 3.00 | 2.55 | 1.00 | 0.59 | 2.00 | 2.20 | 1.25 | 0.84 | 2.50 | 2.50 | 1.00 | 0.54 |
| Col11A1 score | 1.00 | 2.05 | 4.50 | 2.48 | 1.00 | 1.87 | 4.00 | 2.15 | 1.00 | 2.60 | 3.50 | 2.30 | 2.00 | 2.00 | 2.00 | 2.19 |
The classifier has failed 11 samples, 5 of which were FP, and the other 6 were FN. The three main differences between the TP and TN groups are a positive Vascular invasion in the TP group, a higher median Tumor size of 3 cm (versus 1.5 cm in the TN group), and a lower median Age at diagnosis of 55 years in the TP group (versus 58.50 in the TN group). The main difference between TP and FP groups is the Age at diagnosis that is much higher in the FP group (67 years old vs 55). Finally, Figure 3 shows the correlation network for the Lymph Nodes prediction problem and shows the relationships between the most discriminatory variables.
Figure 3.Lymph nodes metastasis prediction. Correlation network among the most discriminatory prognostic variables.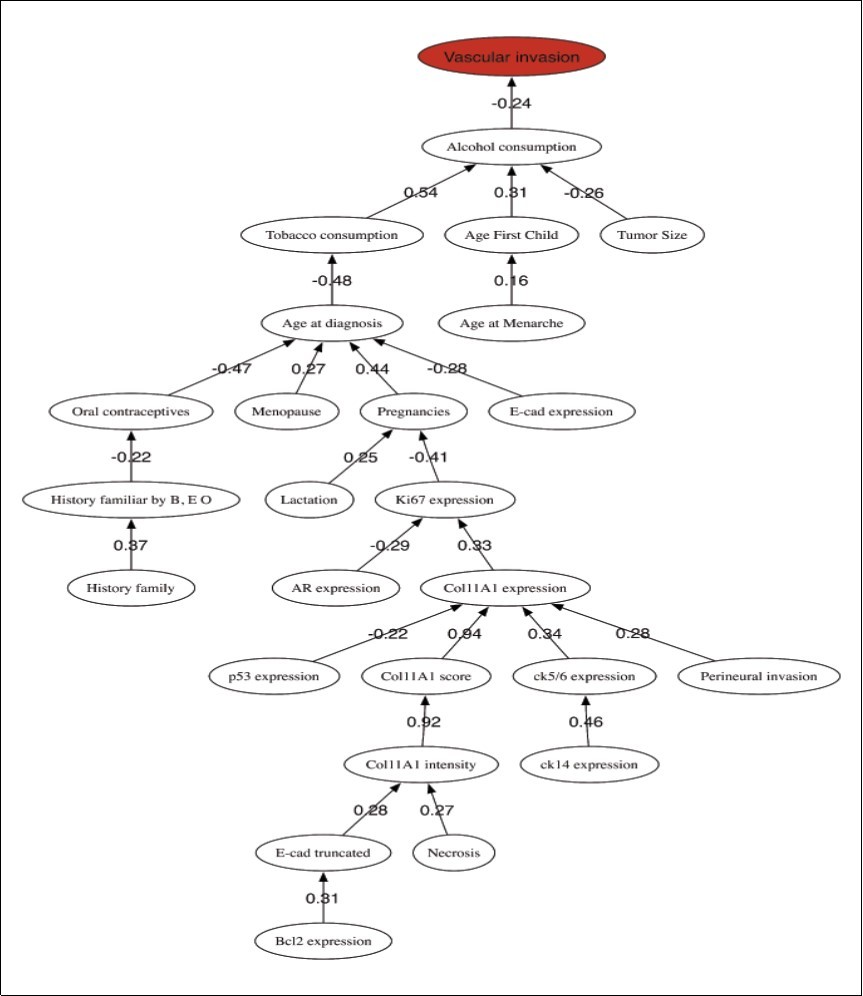
Discussion
Regarding the most discriminatory prognostic variables of the histological grade, it is interesting to note that women in the HG2 group did not have any Oral contraceptives intake. Population studies aimed at exploring associations between oral contraceptive use and cancer risk have shown that the risks of endometrial and ovarian cancer appear to be reduced with the use of oral contraceptives, whereas the risks of breast, cervical, and liver cancer appear to be increased 30. Other relevant values related with patients in the HG2 group with respect to the HG3 group are: higher Age at diagnosis, Lactation habits, and number of Pregnancies (an average of 2.3 children for women in HG2 group vs 1.7 in HG3 group); lower tumor size (Tsize) and Tobacco smoking; and lower values of the immuno-histochemical variables, except for the AR (Androgen Receptor) expression. These results provide new insights concerning the clinical features and habits that might influence a better prognosis.
The best prediction of the HG (disregarding the Nottingham grading system) was performed by a list of only 6 prognostic variables: Ki67 expression, Oral contraceptives, Col11A1 score, E-cad truncated, Tumor Size, and Col11A1 expression, with a very stable accuracy (93.8%), sensitivity (97.0%) and specificity (76.0%). Once again, the importance of Oral contraceptives in the HG prediction is highlighted. All these variables are crucial for breast cancer diagnosis and treatment 11, 12, 13, 14, but their combination has never been explored for HG assignment. The analysis of other equivalent networks has confirmed that Tumor size, Ki67 expression, Oral contraceptives, E-cad truncated, Col11A1 expression, p53 expression and Age at diagnosis are the most important prognostic variables in this prediction problem, and should be compulsory monitored to establish this important medical decision. The role of Ki67 expression as a prognostic marker in breast cancer has been also outlined by 39 in a large-base cohort study, concluding that it is associated with common histopathological parameters and as an additional independent prognostic factor for disease free and overall survivals. The relationship with the epithelial /mesenchymal (EMT) transition, expressed by the presence of ColA11, the truncated E-Cadherin and with the oral contraceptives intake are two main novelties of this analysis, since the samples with null Oral contraceptives intake fall in the HG2 group. Obviously, these values only provide general trends due to the possible presence of behavioral outliers.
The correlation network shows two main branches connecting Ki67 expression to Tumor size and AR expression, both with low correlation coefficients. Two branches start from AR through CK14 expression and E-cad truncated, both weakly correlated to the AR node with negative coefficients. In the tumor size branch, all the variables seem to be related to habits and clinical features, Age at diagnosis, Menopause, Tobacco smoking, Oral contraceptives, etc. The low correlation among all these variables implies that they should be considered as independent prognostic factors. This graphic also confirms the strong correlation between the three representations of the Col11A1 protein. The role of the Androgen Receptor in breast cancer has been reviewed by 40, concluding that AR expression might play a role during tumor progression. Although histologic grading has become widely accepted as a powerful indicator of prognosis in breast cancer, no connections with other biomarkers has been made relevant. In our opinion this is one major findings of this research that will serve to improve the actual methods of prognosis.
In the case of the lymph nodes metastasis, the most important variables are Vascular invasion, Tumor size, Perineural invasion, Family history, Age at diagnosis, Ki67 expression and COl11A1 score, with a high predictive accuracy (84.7%), sensitivity (78.0%) and specificity (89.0%). All the samples presenting metastasis have positive Vascular invasion (vs almost null in the non-metastasis group), a higher Tumor size mean of 2.74 cm (vs. 1.92 cm), positive Perineural invasion, highest age for first child (25.78 vs 24.62) and higher CK14 and CK5/6 expressions. The analysis of the equivalent networks with accuracies higher than 83% show high stability and a good ability for diagnostic. All these signatures share the Vascular invasion and Tumor Size as leading prognostic variables. Likewise, Col11A1 score, Perineural invasion and/or Necrosis also appear in these networks. The ROC analysis established Vascular invasion and Tumor size as the main differences between the true positive (TP) and true negative (TN) groups, and also showed the existence of a group of TNBC cancers with absence of Vascular and Perineural invasion that presents lymph nodes metastasis (FN group). This kind of cancers have a lower median Tumor size (around 2.15 cm) than the FP group, and a median Col11A1 score value of 2. This knowledge is very important to improve the prediction of Lymph Nodes Metastasis at diagnostic. The correlation network shows one main branch starting from Vascular invasion and linking to Alcohol Consumption and other personal habits (Tobacco consumption) and clinical features (Age at First Child, and Tumor Size). Again, the correlations coefficients among these variables are very low. Interestingly, the immuno-histochemical variables appear at the base of the tree, indicating their lower importance in the metastasis prediction.
Finally, an interesting remark is that the HG and lymph node metastasis predictions share the Tumor size, Ki67 expression, and Col11A1 score as high discriminatory prognostic variables, confirming a certain link between both problems. Besides, Col11A1 score has a much higher predictive power than the other two representations of this protein. It is not surprising the relationships with vascular and perineural invasions, as well as with the tumor size or ki67 expression, but this analysis provides novel relationships with the expression of ColA11 protein and also with the patient's age.
Conclusions
This study was dedicated to the HG and the lymph nodes metastasis prediction, crucial for developing more suitable treatment strategies. As results, we present the main clinical and pathological variables and their correlation networks for both prediction problems, via novel machine learning techniques. These variables are currently being used for prognosis and treatment in medical practice. HG was predicted with an accuracy of 93.8% using a list of 6 prognostic variables with significant implications: Ki67 expression, use of Oral contraceptives, Col11A1 expression, Col11A1 score, E-cad truncated and Tumor size. The lymph nodes metastasis was predicted with an accuracy of almost 85% using only 6 prognostic variables: Vascular invasion, Tumor size, Perineural invasion, Age at diagnosis, Ki67 expression, and Col11A1 score. This analysis also served to establish the median signatures of the groups with and without lymph node metastasis, and proved the existence of a kind of small-size tumors (around 2.15 cm) with lymph node metastasis but not showing vascular and perineural invasions and higher protein Col11A1 score. Besides, these signatures proved to be very stable. The additional information conveyed by the prognostic variables found in these two classification problems provides new insight about the genesis and progression of this disease and can be used in medical practice to improve decisions in patient diagnosis and further treatment.
We expect that the conclusions attained by this analysis will contribute to improve the understanding, diagnosis and prognosis of this important type of heterogeneous cancers. This methodology could be also used to predict treatment response when this kind of information is available, as we have shown in the case of Hodgkin Lymphoma 18.
List of Abbreviations
TNBC, Triple Negative Breast Cancer; HG, histological grade; ER, Estrogen Receptors; PR, Progesterone Receptors; HER2, Human Epidermal Growth factor 2 receptors; AR, androgen receptor; EMT, epithelial–mesenchymal transition; MC, Mitotic Count; Necr, necrosis; NP, Nuclear Pleomorfism; PI, Perineural invasion; TF, Tubular formation; TS, Tumor size; VI, Vascular invasion; HUCA, Hospital Universitario Central de Asturias; TP, true positive; TN, true negative; IQR, interquartile range; LOOCV, Leave-One-Out Cross-Validation; ROC, Receiver Operating Characteristic; FR, Fisher’s ratio.
Declarations
Ethics Approval to Participate and Consent for Publication
All procedures performed in studies involving human participants were in accordance with the ethical standards of the Ethics Committee of Clinical Investigation of the Principado de Asturias (IRB approval No. 193/17) and with the 1964 Helsinki declaration and its later amendments or comparable ethical standards. Informed consent was obtained from all individual participants included in the study.
Availability of data and material: TNBC_Study_HUCA.xlsx excel sheet with the described dataset is available.
Funding
No funding was received to perform this research.
Authors' Contributions
A. Cernea, J.L. Fernández Martínez, E. de Andrés designed the machine learning methodology, performed the modeling and contributed to the interpretations. Celia Fernández-Brillet helped with the methodology, the revision and the English style corrections. J.A. Galván, and C. García Pravia gathered the dataset and contributed to the interpretations. All of them contributed to the paper writing and revision.
Acknowledgements
We would like to express our sincere gratitude to the Pathology Anatomy Service from the Hospital Universitario de Asturias, who made possible this research by making available the described dataset.
References
- 1.S B Edge, C. (2010) The American joint committee on cancer: the 7th edition of the AJCC cancer staging manual and the future of TNM. , Ann Surg Oncol 17(6), 1471-1474.
- 2.E A Rakha, J S Reis-Filho, Baehner F, D J, Decker T et al. (2010) Breast cancer prognostic classification in the molecular era: the role of histological grade. , Breast Cancer Res 12(4), 207.
- 3.K R Bauer, Brown M, R D Cress, C A Parise, Caggiano V. (2007) Descriptive analysis of estrogen receptor (er)-negative, progesterone receptor (pr)-negative, and her2-negative invasive breast cancer, the so-called triple- negative phenotype: a population-based study from the California cancer registry. Cancer. 109(9), 1721-1728.
- 4.Sorlie T, C M Perou, Tibshirani R, Aas T, Geisler S et al. (2001) Gene expression patterns of breast carcinomas distinguish tumor subclasses with clinical implications. Proc Natl Acad Sci U S A 98(19), 10869-10874.
- 5.Yersal O, Barutca S. (2014) Biological subtypes of breast cancer: Prognostic and therapeutic implications. , World J Clin Oncol 5(3), 412-424.
- 6.Badve S, D J, S J, F L Baehner, Decker T et al. (2011) Basal-like and triple-negative breast cancers: a critical review with an emphasis on the implications for pathologists and oncologists. Mod Pathol. 24(2), 157-167.
- 7.C M Perou, Sorlie T, M B Eisen, Rijn M van de, S et al. (2000) Molecular portraits of human breast tumours. Nature. 406(6797), 747-752.
- 8.Goldhirsch A, W C, A S Coates, R D Gelber, Thurlimann B et al. (2011) Strategies for subtypes–dealing with the diversity of breast cancer: highlights of the st. gallen international expert consensus on the primary therapy of early breast cancer 2011. Ann Oncol. 22(8), 1736-1747.
- 9.Liedtke C, Mazouni C, K R Hess, Andre F, Tordai A et al. (2008) Response to neoadjuvant therapy and long-term survival in patients with triple-negative breast cancer. , J Clin Oncol 26(8), 1275-1281.
- 10.Fadare O, F A Tavassoli. (2008) Clinical and pathologic aspects of basal-like breast cancers. , Nat. Clin. Pract Oncol 5(3), 149-159.
- 11.H J Bloom, W. (1957) Histological grading and prognosis in breast cancer; a study of 1409 cases of which 359 have been followed for 15 years. , Br J Cancer 11(3), 359-377.
- 12.C W Elston, I O Ellis. (2002) Pathological prognostic factors in breast cancer. i. the value of histological grade in breast cancer: experience from a large study with long-term follow-up. Histopathology. 41-3.
- 13.Genestie C, Zafrani B, Asselain B, Fourquet A, Rozan S et al. (1998) Comparison of the prognostic value of Scarff-Bloom-Richardson and Nottingham histological grades in a series of 825 cases of breast cancer: major importance of the mitotic count as a component of both grading systems. Anticancer Res. 18-1.
- 14.Simpson J G.Prognostic value of histologic grade and proliferative activity in axillary node-positive breast cancer: results from. the EasterEastern Cooperative Oncology Group Companion Study, EST 4189. J Clin Oncol [PubMed] 2000, 2059-2069.
- 15.T KuopioaY Collan. (1996) Mitotic Count in Breast Cancer: The Influence of Training on Performance. Pathology - Research and Practice, Volume 192, Issue 11 1095-1099.
- 17.Noguchi Hiroshi. (2016) Membrane tubule formation by banana-shaped proteins with or without transient network structure. DOI 10.1038/srep20935 , Sci. Rep 6, 20935.
- 18.E J deAndrés-Galiana, J L Fernández-Martínez, Luaces O, J Del Coz, Fernández R et al. (2015) On the prediction of Hodgkin lymphoma treatment response. Clin Transl Oncol. 17(8), 612-619.
- 19.E J deAndrés-Galiana, J L Fernández-Martínez, Luaces O, J del Coz, Huergo-Zapico L et al. (2016) Analysis of clinical prog-nostic variables for chronic lymphocytic leukemia decision-making prob- lems. , Journal of Biomedical Informatics 60, 342-351.
- 20.E J deAndrés-Galiana, J L Fernández-Martínez, S T. (2016) Sensitivity analysis of gene ranking methods in phenotype prediction. , J Biomed Inform 64, 255-264.
- 21.E J deAndrés-Galiana, J L Fernández-Martínez, S T. (2016) Design of biomedical robots for phenotype prediction problems. , J Comput Biol 23(8), 678-692.
- 22.P C Clahsen, Velde C J van de, Duval C, Pallud C, A M Mandard et al. (1999) The utility of mitotic index, oestrogen receptor and ki-67 measurements in the creation of novel prognostic indices for node- negative breast cancer. Eur J Surg Oncol. 25(4), 356-363.
- 23.Joensuu H, Isola J, Lundin M, Salminen T, Holli K et al. (2003) Amplification of erbb2 and erbb2 expression are superior to estrogen receptor status as risk factors for distant recurrence in pt1N0M0 breast cancer: a nationwide population-based study. Clin Cancer Res. 9(3), 923-930.
- 24.Dawson S-J, Makretsov N, F M Blows, K E Driver, Provenzano E et al. (2010) Bcl2 in breast cancer: a favorable prognostic marker across molecular subtypes and independent of adjuvant therapy received. , Br J Cancer 103(5), 668-675.
- 25.Abdel-Fatah T M A, Perry C, Dickinson P, Ball G, Moseley P et al. (2013) Bcl2 is an independent prognostic marker of triple negative breast cancer (TNBC) and predicts response to anthracycline combination (ATC) chemotherapy (CT) in adjuvant and neoadjuvant settings. Ann Oncol. 24(11), 2801-2807.
- 26.Bouchalova K, Svoboda M, Kharaishvili G, Vrbkova J, Bouchal J et al. (2015) Bcl2 is an independent predictor of outcome in basal-like triple-negative breast cancers treated with adjuvant anthracycline-based chemotherapy. Tumour Biol. 36(6), 4243-4252.
- 27.Surget S, M P Khoury, Bourdon J-C. (2013) Uncovering the role of p53 splice variants in human malignancy: a clinical perspective. Onco Targets Ther. 7, 57-68.
- 28.Coradini D, Biganzoli E, Ardoino I, Ambrogi F, Boracchi P et al. (2015) p53 status identifies triple-negative breast cancer patients who do not respond to adjuvant chemotherapy. Breast. 24(3), 294-297.
- 29.García-Pravia C, J A Galvan, Gutiérrez-Corral N, Solar-García L, García- Pérez E et al. (2013) Overexpression of col11a1 by cancer- associated fibroblasts: clinical relevance of a stromal marker in pancreatic cancer. PLoS One. 8(10), 78327.
- 30.Cernea A, Fernández-Martínez J L, deAndrés-Galiana E J. (2018) Sampling Defective Pathways in Phenotype Prediction Problems Via the Fisher’ Ratio Sampler. in Bioinformatics and Biomedical Engineering (LNCS, volume 10814), also part of the Lecture Notes in Bioinformatics book sub series - Springer International Publishing AG, part of Springer Nature LNBI 10814, 15-23.
- 31.Fernández-Martínez J L, Cernea A, deAndrés-Galiana E J. (2018) Sampling Defective Pathways in Phenotype Prediction Problems Via the Holdout Sampler. in Bioinformatics and Biomedical Engineering. (LNCS, volume 10814), also part of the Lecture Notes in Bioinformatics book sub series - Springer International Publishing AG, part of Springer Nature LNBI 10814, 24-32.
- 32.Cernea A, Fernández-Martínez J L, deAndrés-Galiana E J. (2018) Comparison of Different Sampling Algorithms for Phenotype Prediction. in Bioinformatics and Biomedical Engineering. (LNCS, volume 10814), also part of the Lecture Notes in Bioinformatics book sub series - Springer International Publishing AG, part of Springer Nature LNBI 10814, 33-45.
- 33.S H Park, J M Goo, Jo C-H. (2014) Receiver Operating Characteristic (ROC) Curve: Practical Review for Radiologists. , Korean Journal of Radiology 5(1), 11-18.
- 34.J B Kruskal. (1956) On the shortest spanning subtree of a graph and the traveling salesman problem. Proceedings of the American Mathematical Society 7(1), 48-50.
- 35.L N Saligan, J L Fernández-Martínez, J deAndrés Galiana E, Sonis S. (2014) Supervised classification by filter methods and recursive feature elimination predicts risk of radiotherapy-related fatigue in patients with prostate cancer. Cancer Inform. 13, 141-152.
- 36.Cheng Q, Zhou H, Cheng J. (2011) The Fisher-Markov Selector: Fast Selecting Maximally Separable Feature Subset for Multiclass Classification with Applications to High-Dimensional Data,". , in IEEE Transactions on Pattern Analysis and Machine Intelligence 33, 1217-1233.
- 37.J L Fernández-Martínez, E J deAndrés-Galiana, S T. (2017) Genomic data integration in chronic lymphocytic leukemia. , J Gene Med
- 38.Burkman R, J, Zieman M. (2004) Safety concerns and health benefits associated with oral contraception. Suppl):S5–22 , Am J Obstet Gynecol
Cited by (8)
This article has been cited by 8 scholarly works according to:
Citing Articles:
Tạp chí Y Dược học Cần Thơ (2023) OpenAlex
(2023) Crossref
Springer eBooks (2023) OpenAlex
Pharmacogenomics and Personalized Medicine (2020) OpenAlex
Pharmacogenomics and Personalized Medicine (2020) Crossref
Óscar Álvarez-Machancoses, Enrique J DeAndrés Galiana, A. Cernea, Javier Fernández Sánchez de la Viña, J. Fernández-Martínez - Pharmacogenomics and Personalized Medicine (2020) Semantic Scholar
J. Fernández-Martínez, Óscar Álvarez-Machancoses, Enrique J. deAndrés-Galiana, G. Bea, A. Kloczkowski - International Journal of Molecular Sciences (2020) Semantic Scholar
International Journal of Molecular Sciences (2020) OpenAlex
Enrique J. deAndrés-Galiana, J. Martínez, S. Sonis - J. Comput. Biol. (2016) Semantic Scholar