
Abstract
Dams are built to produce electricity, store water for irrigation, control flood hazards and other uses. The operation of dam has a complicated problem, which includes multiple decision variables, several conflicting and contradictory objectives together with significant uncertainty and risk. The objective of this study was to make an impact assessment that Fincha’a-Amarti dam operation can bring on the downstream activity. Fincha’a-Amarti dam downstream irrigation water requirement was done by using CROPWAT software. The SWAT model was also used to model the watershed and simulate the flow. Meteorological data and spatial data of the study area were used as an input of the model. The meteorological stations considered were Shambu, Fincha’a, Homi, Nashe and Harato. The study shows that downstream water requirement greater than the existing downstream water release during the months of: January, February, March, April, May, September, October, November and December; but existing water release is greater than downstream water requirement during wet season only. Therefore, the study concludes that there is downstream water stress except during wet season.
Author Contributions
Academic Editor: Jayanta Das, Rampurhat College.
Checked for plagiarism: Yes
Review by: Single-blind
Copyright © 2023 Fuad Abdurazak, et al.
 This is an open-access article distributed under the terms of the Creative Commons Attribution License, which permits unrestricted use, distribution, and reproduction in any medium, provided the original author and source are credited.
Competing interests
The authors have declared that no competing interests exist.
Citation:
Introduction
Dams have been built for thousands of years for electricity, irrigation, flood control and water supply. The world commission on dams indicated that one-third of the countries in the world rely on hydropower for more than half of their electricity supply 21. The development of operation of reservoir is a complicated problem, which includes multiple decision variables, several conflicting and contradictory objectives together with significant uncertainty and risk 10. Designing and attaining operating rules for multi-reservoir structures is a challenging job and has been extensively generated during the scientific past of researches that are associated with the management of water resources 12.
Conventionally, operation of reservoir is accomplished based on heuristic measures, comprising storage curves and skewed decisions made by the decision makers to release water from the reservoir conferring upon the existing stage of the reservoir, prevailing water demands, current hydrological conditions, and the period of the year 13. To control the problem of inadequate supply of water during lean season, focus has been given on improving management of existing water resources, especially in the optimization of operations of reservoir 4. Improper operation of any reservoir especially in the case of series reservoir systems will lead to technically and economically inefficient operation that fail to meet the desired objective 8.
In the 1960s, investigations showed that the Fincha’a River, a tributary of the Blue Nile in western Ethiopia, had great potential for a multi-purpose dam that would provide power generation and water storage for fisheries, irrigation, and recreation. Following these studies, a dam was constructed in 1973. The lake created after completion of the dam initially submerged an area of about 100 km2, but a few years later the area had increased to 149 km22. In 1987, an additional dam was constructed across the Amarti River, which flows parallel to the Fincha’a River. The purpose of this second dam was to divert water from the Amarti to the Fincha’a reservoir through a tunnel and raise its capacity for hydroelectric power generation from 185 million m3 to 460 million m3of water. The dam has an installed capacity of 128 MW and produces 27% of the national power supply 17.
Currently all the downstream activities level of development is below 50% of their total potential capacities and hence the minimum power release effectively satisfies the daily downstream demands. However, as the downstream irrigation project expands and the corresponding factory production capacity increases, the daily minimum water demand increases and reaches the point where the downstream water requirement affect the daily power generation pattern 3. Reservoir operators must simultaneously meet water demands that rise from all stakeholders and other natural ecosystem activities. Each of these demands imposes constraints on the storage and release of water from the reservoir, and needs and constraints often conflict with one another 15
Fincha’a and Amarti reservoirs are the sources of water for Fincha’a power plant and the downstream activities. The reservoirs are joined by the diversion tunnel that enables the Amarti reservoir to augment the Fincha’a reservoir. In the existing operation, the tunnel gate is ruled by seasonal gate operation pattern, that is the gate is open mainly from early June to end of September or early October and closed otherwise. Due to this seasonal operation pattern there are high evaporation and spillage losses from the two reservoirs due to early or to late releases, respectively.
Due to the expansion of Fincha’a sugar factory at the downstream and the level of the development of the people the current release water to downstream cannot satisfy the total downstream requirements 15. Regarding the new Fincha’a-Amarti project reservoir, the government is justifying it as for the purpose of national economic development through hydroelectric power generation and irrigation scheme in lower parts of Fincha’a valley so as to realize the growth and transformation plan 15. But, the view of the local people is different, hence; they blame the project for its far reaching social, economic and environmental side effects on their lives and the zone is still suffering from scarcity of energy as well as water supply. There is also lack of enough irrigation water to irrigate sugarcane plant throughout the year, therefore row material for Finch sugar factory were minimized. In order to avoid the misunderstanding of the policy makers from the government side and the poor societies within and around project area, there must be a need to manage water resources and improve water release rule to meet current and future water demands. Hence, it is important to carry out as assessment of existing Fincha’a-Amarti dam operation impacts on downstream surface hydrology in order to avoid conflicts that may appear downstream.
The main purposes of the research were: to determine downstream water requirement using CROPWAT model, to simulate downstream surface runoff making use of SWAT software, to assess Fincha’a-Amarti dam operation impacts on downstream activity and to identify possible measures to mitigate the impact of dam operation on downstream surface hydrology. The research result can be used to notify the effect of dam operation on the downstream water needs and develop action plan to minimize downstream impact. The research finding will support other researchers to analyze reservoir operation modeling to avoid existing water release problem. The study was limited to determine downstream water requirement and downstream water stress occurred due to Fincha’a-Amarti dam operation.
Materials and Methods
Location of the Study Area
Blue Nile Basin is found in the western part of Ethiopia, between 7045’ and 12045’N and34005’ and 39045’E is one of the largest basins in the country with high population pressure, degradation of land and highly dependent on agricultural economy 20. Based on topography and geographic location, the study area is categorized into three major climates: the cool zone, temperature zone and hot zone 16.
Fincha’a sub basin is one of Blue Nile sub basin which is located between 9°10’30″ and 9°46'45″ N latitude and 37°03'00″ and 37°28'30″ E longitude. Fincha’a-Amarti Dam is located about 310km north-west of Addis Ababa, in Oromia region, Horro Guduru Wollega Zone, Abbay Chomen district in the Blue Nile River Basin. Average annual rainfall in the area is about 1350 mm, 85%, of which falls during the 3-month rainy season from mid-June to mid-September 6. Fincha’a dam is an earth and rock fill embankment structure with a length of 340m and 22.2m high 9. The dam crest is at 2225masl and located 900m upstream of the Fincha’a fall. This dam is constructed for hydropower and irrigation purposes 5. The Location of the Study Area is presented on the figure 1.
Figure 1.Location map of the study area
Materials Used
Hydrological models are mathematical descriptions of components of the hydrologic cycle. They have been developed for many different reasons and therefore have many different forms. However, hydrological models are in general designed to get a better understanding of the hydrologic processes in a watershed and how changes in the watershed may these phenomena and for hydrologic prediction 11
In order to achieve the objectives of this work, generally the following extra materials are used by integrating to each other according to their importance: Arc GIS V 10.4 was used to obtain hydrological and physical parameters, spatial information and prepare input for Arc SWAT. Arc SWAT used to simulate surface runoff at Fincha’a-Amarti sub basin; SWAT CUP was used to calibration and validation of output data from Arc SWAT, CROPWAT software used to determine downstream crop water requirement especially for Fincha’a sugar factory irrigation command area.
Methodology
The procedures followed to conduct the research ware presented on the figure 2.
Figure 2.Simplified flow chart of the methodology adopted in the study
Data Collection
The data needed to achieve the study objective are collected from different responsible body. The data used in this study were collected from different responsible bodies, which presented on the table 1.
Table 1. Sources where secondary data collected.| Data collected | Place where data collected |
|---|---|
| Meteorological Record Data | National Meteorological Agency |
| Gauged Flow Data | Ministry of Water, Irrigation and Energy |
| Digital Elevation Model (DEM) | Ministry of Water, Irrigation and Energy |
| Land use Land Cover Data | Ministry of Water, Irrigation and Energy |
| Soil Data | Ministry of Water, Irrigation and Energy |
Data processing and Analysis
Filling of Missed Data
To perform hydrological analysis and simulation using data of long time series, filling in missing data is very vital. These gaps can be filled using data from the surrounding gauging stations located within the basin on the assumption that the group of stations has a metrological similarity 18. The methods mostly to be used in hydrology for filling the missing data are Arithmetic mean method, Normal ratio method, Inverse distance methods and Distance power methods. The Normal ratio method was used to make the data series continuous because the study area has undulating topography and also has more than 10% missing station.
Test for Consistency of Rainfall Data
Rainfall data reported from a station may not always be consistent. The double mass curve uses to check and correct the consistency of the record. The slope of the line of the group of the station is used to correct the record 7. In this research the cumulative mean annual rainfall of the four gauging stations, which means all stations except the Shambu station in the first case, and the cumulative annual rainfall of the Shambu station were evaluated. Similarly, it was done for Fincha’a station also. The deviation of the curve from the straight line was insignificant and not considered as an error. The graphs 2.3 and 2.4showed that all points set on or from almost the straight lines, which was plotted for checking of consistency of rainfall, all stations were consistent to each other. Therefore, the stations did not need further correction.
Figure 3.Double mass curve a for Shambu vs average annual cumulative of 4 stations
Modeling and Data Analysis
CROPWAT Model
CROPWAT is a decision support system developed by the Land and Water Development Division of FAO for planning and management of irrigation 19. In Fincha’a Valley most of the land was covered by sugarcane plant due to the presence of a sugar factory in the valley. In this research CROPWAT.8 is used to determine Fincha’a valley irrigation Water Requirement. The procedure used to obtain the value of crop water requirement using CROPWAT 8.0 software is as follows:
1. Input climate data
2. Input monthly rainfall data
3. Input crop characteristic data
4. Input soil characteristic data
5. Obtaining the value of daily crop water needs
To compute the water that is needed to meet the irrigation demand aimed at the intended farming land, the subsequent parameters has been computed: reference evapotranspiration, crop evapotranspiration and irrigation water requirement. The equations used to determine Fincha’a valley irrigation water requirements are presented on equation: 2.1, 2.2and 2.3 respectively. CROPWAT calculates daily reference evapotranspiration using equation 2.1.
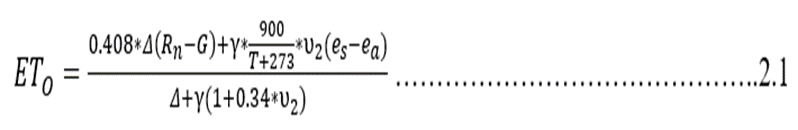
where: ETO: Reference evapotranspiration in mm/day, Rn: Net radiation at the crop surface in MJ m-2 day-1, G: Soil heat flux density in MJ m-2 day-1, T: Mean daily air temperature in °C, u2: Wind speed in ms-1, es: Saturation vapor pressure in kPa, ea: Actual vapor pressure in kPa, es - ea: Saturation vapor pressure deficit in kPa, D: Slope vapor pressure curve in kPa °C-1, and g: Psychometric constant in kPa °C-1.
CROPWAT estimates crop evapotranspiration (ETc) according to Equation 2.2

Where: ETc: Crop water Requirement (mm/day), ETO: Reference evapotranspiration in mm day-1, Kc: Crop coefficient. CROPWAT model calculates irrigation water requirement using the Equation 2.3.

Where: IWR: Irrigation water requirement (mm/day), ETc: Crop water Requirement (mm/day), Pe: Effective Rainfall in mm
Arc SWAT Model
SWAT model is a semi distributed; time continuous watershed simulator operating on daily time step 1. SWAT is used worldwide and has been chosen by the Environmental Protection Agency to be one of their Better Assessment Science Integrating Point and Nonpoint Sources models 14. In this research Arc SWAT version 2012 was downloaded from SWAT website and its toolbar was added to Arc GIS10.4.1 for modeling process. The procedure of the model is presented on figure 5.
Figure 5.Procedure of the SWAT software adopted
Spatial Data Projection
All spatial data sets were projected to UTM 37 North and D_WGS_1984 datum. Projections were done using ArcGIS 10.4’s raster and vector standard world project tools. The UTM projection was chosen as it is commonly used for larger areas in GIS.
Digital Elevation Model (DEM)
DEM data used in the study was obtained from Ministry of Water, Irrigation and Energy. It was of 30*30 m resolution. As it was DEM of the whole Abay basin, it had to be cropped using the study area boundary as a mask .
Land use Land Cover Data
The land use map of Abay basin, originally from the Ministry of Water, Irrigation and Energy (1992-2020) was used as a benchmark in producing the land use map of the study area. Like with the DEM, the land cover was then cropped to fit the study area by overlying the Fincha’a Sub basin. SWAT has predefined land uses identified by four-letter codes and it uses these codes to link land cover maps to SWAT land cover databases in the GIS interfaces. Hence the land cover types were redefined so as to match the input needs of the model.
Watershed Delineation
The soil map, LU/LC map and the DEM were projected using GIS 10.4.1 to the same projection prior to watershed delineation. This was done to overlap the three maps during SWAT modeling. The watershed and sub watershed delineation was performed using 30m by 30m resolution of DEM data and using Arc SWAT model watershed delineation function.
Determination of Hydrologic Response Units (HRUs)
A step next to watershed delineation is determination of hydrologic response unit. The SWAT user’s manual suggests that a 20% land use threshold, 10% soil threshold and 20% slope threshold are adequate for most modeling application. However according to (Melesse, 2008) suggestion HRU definition with multiple options that account for 10% land use, 20% soil and 10 slope threshold combinations gives a better estimation of runoff and sediment components. Therefore, for this study, HRU definition with multiple options that accounts for 10% land use, 20% soil and 10% slope threshold combination was used to eliminate minor land use and land covers in sub basin, minor soil within a land use and land cover area and minor slope classes within a soil on specific land use and land cover area.
Weather Data
After HRU analysis the weather data to be used in a watershed simulation was imported using the first command in the Write Input Tables menu item on the Arc SWAT toolbar. This tool helps to load weather station locations into the current project and assign weather data to the sub watersheds. The weather data definition is divided into six tabs: weather generator data, rainfall data, temperature data, solar radiation data, wind speed data and relative humidity data. Therefore, for weather generator data definition, the weather generator data file WGEN user, rainfall data, temperature data, relative humidity data; solar radiation data and wind speed data were selected and added to the model respectively.
Surface Runoff Simulation
Surface Runoff Volume
SWAT provides two methods for estimating surface runoff: the SCS curve number method (SCS, 1972) and the Green & Ampt infiltration method (1911). Even though the latter method is better in estimating runoff volume accurately, its sub-daily time step data requirement makes it difficult to be used for this study. As the data inputs in this study are on daily basis, the SCS curve number method was adopted. The accumulated runoff or rainfall excess was calculated by using equation 3-6.

where:
· Qsurf is accumulated runoff or rainfall excess (mm water)
· Rday is rainfall depth for the day (mm water)
· Ia is an initial abstraction which includes surface storage, interception and infiltration prior to runoff (mm water)
· S is a retention parameter (mm water)
Reservoir
Equation of water balance for reservoir used by the SWAT program is

where:
· V is the volume of the water in the impoundment at the end of the day in m3
· Vstored is the volume of water stored in the water body at the beginning of the day in m3
· Vflowin is the volume of water entering the water body during the day in m3
· Vflowout is the volume of water flowing out the water body during the day in m3
· Vpcp is the volume of precipitation falling on the water body during the day in m3
· Vevap is the volume of water removed from the water body by evaporation during the day in m3
· Vseep is the volume of water lost from the water body by seepage in m3
Precipitation
The volume of precipitation falling on the reservoir during a given day is calculated:

· Vpcp is the volume of water added to the water body by precipitation during the day in m3
· Rday is the amount of precipitation falling on a given day in mm
· SA is surface area of the water body (ha)
Evaporation
The volume of water lost to evaporation on a given day is calculated by:
Vevap is the volume of water removed from the water body by evaporation during the day in m3, η is an evaporation coefficient (0.6), Eo is the potential evaporation for a given day in mm and SA is surface area of the water body (ha).

Seepage

Outflow
The volume of outflow may be calculated using one of four different methods: measured daily outflow, measured monthly outflow, average annual release rate for uncontrolled reservoir, controlled outflow with target release. This study followed measured monthly outflow method. The volume of outflow in this method is calculated by:

where
· Vflowout is the volume of water flowing out of the water body during the day in m3
· qout is the outflow rate in m3/sec
Sensitivity Analysis, Evaluation of Simulation, Calibration and Validation
Sensitivity Analysis
Prior to calibration and validation process, sensitivity analysis was carried out to reduce the number of parameters that needs optimization. In this research semi-automated Sequential Uncertainty Fitting (SUFI 2) was used to identify the sensitive parameters. This was done to select the most flow influencing parameters in the catchment. The number of simulations used for calibration was 30, which is large enough to get accurate results for global sensitivity analysis. SUFI-2 is superior over other algorithms, because it involves stochastic calibration, where the errors and uncertainties in model are recognized and expressed as ranges accounting for all driving variables. The inclusion of large number of parameters representing different processes in the objective function, in SUFI-2 helps to make the model result enveloping most of the observations well. In this study the t-Stat and P-Values of the parameters were used to rank to the different parameters that may influence the flow and finally to select the ranked values. The model was run on monthly and daily time steps with observed data of the Fincha’a and Amarti River at Fincha’a and Amarti gauging station. For this analysis 20 parameters were selected based on previous literatures and only 8 parameters were identified to have significant influence in controlling the stream flow in the watershed.
In the sensitivity process, the SWAT simulated TxtInout was copied to the working directory and SWAT_CUP SUFI-2 was used for performing the sensitivity of selected parameters with the default lower and upper parameter bounds. The 20 parameters were included for the sensitivity analysis with default values as recommended by SWAT_CUP SUFI-2. Upon completion of sensitivity analysis, a t_ test was used to identify the relative significance of each parameter. The larger in the absolute value of tt-Stat and the smaller of the p-Value the more the sensitive the parameter. The p-value tests the null hypothesis that the coefficient is equal to zero (no effect). A low p-value less than 0.05 indicate that null hypothesis can be rejected. Based on the above criteria, parameters were selected for calibration process and the results were presented in the result and discussion section.
Calibration
After sensitivity analysis, the sensitive parameters were used for model calibration (1994-2011) to optimize the values of those sensitive parameters. After the calibration completed, the model was run using the best parameter output values and the simulations were compared with observed stream flow data using Nash Sutcliffe coefficient (NS), coefficient of determination (R2) and Mean.
Validation
The validation was performed to compare the model outputs with an independent data set without making further change to parameters obtained during the calibration process. The measured data of average monthly stream flow from 2012-20020 at Fincha’a and Amarti Gauging station was used for model validation.
Model Performance Evaluation
The statistical parameters (NS and R2) were used for model evaluation for quantification of accuracy in watershed modeling. The coefficient of determination (R2) describes the proportion of variance in measured data by the model. It indicates the linear relationship between simulated and observed data and ranges from zero (model is poor) to one (model is good). The R2is calculated using the following equation:

where: Q0 is observed discharge , Qs is simulated discharge, Q0 is average observed discharge and Qs is average simulated discharge
The Nash and Sutcliffe simulation efficiency (NS) is computed as

where: Qot is observed discharge at time t , Qst is simulated discharge at time t and Qot is average observed discharge
Effects of Fincha’a dam Operation on Stream Flow
The main goal of this study is to evaluate impacts of Fincha’a dam operation on downstream flow in case of Fincha’a-Amarti dam. Downstream water requirement of Fincha’a-Amarti (FA) dam was determined and compared with existing water release rule and capacity of water shade.
Results
Fincha’a Valley Irrigation Water Requirement Result
The irrigation water requirements (IWR) of the sugarcane planted in different months of the year in Fincha’a Valley were estimated by CROPWAT software for Windows Version 8.0. As determined from these results, the irrigation system at downstream of dam requires 22.7m3/s of water during the peak month April. In the case of wet season, no irrigation diversion was required except small discharge for the small villages in the command area. Total Fincha’a valley irrigation water requirements were shown on appendixes 2. Monthly irrigation requirement result outputs from CROPWAT were arranged in the table 2 below.
Table 2. Fincha`a valley Monthly irrigation requirement (m3/s).| Months Irrigation | Jan | Feb | Mar | Apr | May | Jun | Jul | Aug | Sep | Oct | Nov | Dec |
| requirements(m3/s)| | 14.95 | 18.47 | 20.24 | 22.7 | 19.06 | 18.4 | 2.1 | 2.1 | 15.64 | 16.09 | 15.49 | 14.23 |
As shown on the graph 3.1 and figure 6, Fincha’a irrigation water requirement is less during wet season because it is rainy season. Reversely irrigation water requirement is high during: January, February, March, April, May, June, September, October, November and December.
Figure 6.Fincha'a Valley irrigation water requirement
The total Fincha’a-Amarti (FA) dam downstream water requirements include the downstream irrigation requirement, water supply for sugar factory and Environmental flow were estimated. The total downstream water requirements are given in table 3
Table 3. Total Fincha’a-Amarti dam downstream monthly water requirements (m3/s).| Months | Jan | Feb | Mar | Apr | May | Jun | Jul | Aug | Sep | Oct | Nov | Dec |
| For Irrigation | 14.95 | 18.47 | 20.24 | 22.7 | 19.06 | 18.4 | 2.1 | 2.1 | 15.64 | 16.09 | 15.49 | 14.23 |
| For water supply | 2.5 | 2.5 | 2.5 | 2.5 | 2.5 | 2.5 | 1.13 | 1.13 | 1.13 | 2.5 | 2.5 | 2.5 |
| For Environment | 1.54 | 1.54 | 1.54 | 1.54 | 1.54 | 1.54 | 1.54 | 1.54 | 3.1 | 2.56 | 1.54 | 1.54 |
| Total | 18.99 | 22.51 | 24.28 | 26.73 | 23.09 | 22.44 | 4.76 | 4.76 | 19.87 | 21.15 | 19.53 | 18.27 |
Hydrological modeling with SWAT
Watershed Delineation
The watershed delineation was carried out based on an automatic delineation procedure basing on a Digital Elevation Model (DEM). Default threshold sub basin area that is suggested by the model was used to define the minimum drainage area to form the origin of a stream. The Fincha’a sub basin is divided into 21sub basins based on the threshold area of 14055.4km2 and 66 Hydrologic Response Units (HRUs).
Sensitivity analysis of stream flow parameters
For global sensitivity analysis twenty flow parameters which may affect stream flow were considered from different literatures and only eight parameters were selected to have an influence in controlling the hydrological processes in the watershed. Those parameters were; maximum canopy storage (CANMX), alpha factor (ALPHA_BF), Manning’s “n” value for over land flow (OV_N), effective hydraulic conductivity (CH_K2), deep aquifer percolation fraction (RCHRG_DP),Surface runoff lag coefficient (SURLAG),Ground water revap coefficient (GW_REVAP) and threshold depth of water in the shallow aquifer required for return flow to occur (GWQMN). The result of the sensitivity analysis indicated that the most sensitive parameters were Surface runoff lag coefficient (SURLAG), whereas the least sensitive was Manning’s n value (CH_N2.rte).
Flow calibration result
The Calibration was performed for 18 years’ period from January 1, 1994 to December 31, 2011. The results showed a good correlation between the predicted and observed flows. Table 4 and figure 7 illustrate the values of these statistical parameters for both simulated and measured flow.
Table 4. Values of statistical parameters obtained during calibration.| Calibration Statistics | ||||
| R2 | Nash-Sutcliff efficiency | Standard deviation | Mean | |
| Measured Flow | 0.94 | 91% | 22.69 | 19.21 |
| Simulated Flow | 24.22 | 21.97 | ||
Figure 7.Calibration result of average monthly simulated and measured flow at Fincha’a-Amarti Dam site
Validation Result
The validation was performed for nine (9) years period from January 1st, 2012 to December 31st, 2020. Table 5 and figure 8 shows the validation statistics of the simulated and measured flow. This ensures that the simulated flow shows the same trend with the gauged flow in the time series.
Table 5. Values of statistical parameters obtained during Validation.| Calibration Statistics | ||||
| R2 | Nash-Sutcliff efficiency | Standard deviation | Mean | |
| Measured Flow | 0.95 | 92% | 23.11 | 18.08 |
| Simulated Flow | 22.28 | 21.07 | ||
Figure 8.Validation result of average monthly simulated and measured flow at Fincha’a-Amarti dam site
Flow at Fincha’a–Amarti dam site
Surface runoff is estimated by using SCS curve number method because the data inputs in this study are on daily basis. Surface runoff determined both on Fincha’a and Amarti dam site from 1994-2020 (see appendixes 1). The average monthly flow at Fincha’a –Amarti dam site is computed to be 31.93m3/sec. The minimum average monthly flow is 0.202m3/sec, which is in February, while the maximum is 95.59m3/sec in August. The flow hydrographs of each year witness that: January, February, March, April and December are driest months during when the river flow is small compared to the rest of the months. June, July, August, September and October comprise months of peak discharges during when there is greatest amount of water in the river. This actually mirrors the rainfall of the study area where peak rainfall activities occur in the months of July, August and September. Figure 9
Figure 9.Average monthly simulated flow at Fincha’a –Amarti dam site (1994-2020)
Discussion
Fincha’a-Amarti dam Operation and Downstream Water Requirement
Downstream of the power plant, there are two major water related activities. The activities consist of irrigation and water supply for domestic and factory use. The existing irrigation operation was based on monthly constant release at the diversion intake gate. The result from SWAT simulation at Fincha’a dam site show that, there is enough amount of water discharge in this catchment. But, existing operation is not fulfilling the downstream water need, because the result from existing operation and downstream water requirements are not much together. The graph 3.5 shows that the average Fincha’a-Amarti simulated flow is (31.93m3/s), which is greater than the average existing downstream water release (17.34m3/s). It shows that 14m3/s of discharge was lost by Fincha’a-Amarti dam spillway and evaporation from the two reservoirs. In response to such condition some water management and adaptation were required to minimize water loss. Generally, the graph 3.5 shows that downstream water requirement is greater than the existing downstream water release except during wet season only.
Figure 10.Downstream water requirement and simulated downstream water flow VS existing Fincha’a dam water release rule
Impacts of Fincha’a-Amarti dam operation on downstream surface hydrology
One of the most important parts of the study was to evaluate the hydrological impact of Fincha’a-Amarti dam operation on downstream activity. The evaluation was done depending on the surface runoff, existing operation and downstream water flow requirement. The result shows that downstream water requirement is greater than the existing downstream water release during the months of: January, February, March, April, May, September, October, November and December. Existing Fincha’a dam dater release is greater than downstream water requirement during wet season only (Jun, July and August). Therefore, the existing water release does not effectively satisfy the total downstream demand except wet season, but from simulated discharge the capacity of Fincha’a-Amarti water shade is enough to satisfy downstream activity and increase power generation if proper water management exists. The downstream water demand stress came due to existing operation problem. The closing Amarti tunnel gate from October to May were increased water loss via Amarti spillway. Evaporation loss also increased from Fincha’a-Amarti reservoir.
Conclusion
In this study CROPWAT was used to determine Fincha’a valley irrigation water requirement. According to the result of the study, the Maximum Fincha’a Valley irrigation system requires 22.7m3/s of water during April and no irrigation water required during July and August. The Total Maximum and minimum out flow required to the downstream including the downstream irrigation requirement, water supply for sugar factory domestic use and Environmental flow were 26.73m3/s during April and 4.76m3/s during July and August.
SWAT model was also applied to simulate surface run off at Fincha’a-Amarti dam site. From this result the average monthly simulated flow at the Fincha’a-Amarti dam site is 31.934m3/sec with the minimum average monthly simulated flow being 0.203m3/sec, in February and the maximum average monthly simulated flow being 95.589031m3/sec in August. The mean monthly existing Fincha’a-Amarti dam water release was 17.34m3/s.
For global sensitivity analysis using SWAT CUP (SUFI-2) twenty flow parameters which may affect stream flow were considered from different literatures and only eight parameters were selected to have an influence in controlling the hydrological processes in the watershed. The graphical and statistical results both during calibration and validation period showed adequate model performance with NS values of 0.91 and 0.92 and R2 values 0.94 and 0.95 for calibration and validation respectively. But thee model over predicted the flow in all months both during calibration and validation period. The over estimation of the model could be attributed to uncertainties that might exist in Fincha’a Watershed, such as surface or subsurface water abstractions for irrigation, industrial and rural or urban water supply which were unaccounted for in this study due to data limitation and also quality of observed data
The graphical and statistical results both during calibration and validation period showed adequate model performance with NS values of 0.91and 0.92 and R2 values 0.94 and 0.95 for calibration and validation respectively.
The impacts of Fincha’a-Amarti dam on downstream activity were analyzed after calibration and validation of the model. The result shows that the downstream water requirement is greater than the existing downstream water release except during wet season. Therefore, the existing water release does not effectively satisfy the total downstream demand except wet season only. It is usually the case that a lot of water is lost by Amarti spillway, therefore Amarti tunnel gate must be opened more time to minimize water lost by Amarti spillway. As the main objective of the dam was not only to generate maximum power but also to meet the target demand for irrigation development in the lower sub-basin, Fincha`a-Amarti dam downstream activity should be considered during operation. The existing Fincha`a-Amarti hydropower dam operation does not effectively satisfy the total downstream water demand, therefore, this study recommends that a detailed study on reservoir operation modeling should be conducted to solve downstream problem. The sediment inflow to the reservoir is reducing the capacity of both reservoirs. Hence, this study recommends that the intensive soil and water conservation works is important to minimize the reservoir sedimentation problems from the agricultural and bare lands.
Patents
Author Contributions
Conceptualization, F.A.; methodology, F.A.; software, F.A.; validation, F.A.; formal analysis, F.A.; investigation, F.A.; resources, W.U.; data curation, F.A.; writing-original draft preparation, F.A.; writing-review and editing, F.A.; visualization, F.A.; supervision, D.A.; project administration, E.E.U.; funding acquisition, W.U. All authors have read and agreed to the published version of the manuscript.
Funding
This research was conducted under the regular research program at the Wallaga University.
Data Availability Statement
Data will be made available on request.
Acknowledgments
We would like to express our thanks to Wallaga University for funding this research.
Disclaimer/Publisher’s Note
The statements, opinions and data contained in all publications are solely those of the individual author(s) and contributor(s) and not of MDPI and/or the editor(s). MDPI and/or the editor(s) disclaim responsibility for any injury to people or property resulting from any ideas, methods, instructions or products referred to in the content.
References
- 1.J G Arnold. (2012) SWAT Model Use, Calibration and Validation. , American Society of Agricultural and Biological Engineers
- 2.J G Arnold, N D. (2012) SWAT Model Use, Calibration and Validation. , American Society of Agricultural and Biological Engineers (Vol 55.
- 3.Assefa K. (1994) Valuing environmental quality changes in Horro-Guduru: Field survey report,Wallaga. , Ethiopia
- 4.Belissa A. (2016) Establishing optimal reservoir operation of Fincha`a-Amarti Reservoirs, Ethiopia. Master’s Thesis, Addis Ababa university.
- 7.M H Galata. (2012) Development of water projects and domestic hydropolitics.The Impacts of Water Projects in Ethiopia .
- 8.S K Garg. (1989) Irrigation Engineering and Hydraulic Structures, Eighth revised edition. , New Delhi
- 9.Genet E. (2008) Reservoirs water balance analysis, Joint operation and optimal operation rules for system performance A case proposed reservoirs on the main Blue Nile River.
- 10.HARZA. (1975) . Fincha „a Hydroelectric Project, Ethiopia. Civil Design Memorandum C-1 , Washington, DC HARZA Engineering Company.
- 11.Kaini P. (2012) Optimizing Structural Best Management Practices Using SWAT and Genetic Algorithm to ImproveWater Quality Goal.
- 12.Kassa T. Minch Water Technology Institute,Arba Minch University (2007) Impact of Land Use/Cover Change on Stream Flow: The Case of Hare River Watershed. , Ethiopia. Arba
- 13.D N Kumar. (2006) Optimal reservoir operation using multi-objective evolutionary algorithm.Water Resources Management.
- 14.Kumphon B. (2013) Genetic Algorithms for Multi-objective Optimization: Application to a Multi-reservoir System in the Chi River Basin. , Thailand. Water Resour. Manag
- 15.T K-G Lenhart. (2002) Comparison of two different approaches of sensitivity analysis. Physics and Chemistry of the Earth .
- 16.Loague K. (1991) Statistical and Graphical Methods for Evaluating Solute Transport Models: Over View and Application. , Journal of Contaminant Hydrology
- 17.Melesse. (2008) Spatial delineation of soil erosion vulnerability in the Lake Tana Basin, Ethiopia. Hydrological Processes.
- 18.Misgana L. (2017) Modeling of Fincha’a-Amarti-Nashe Reservoir operation using Hydrologic Engineering Center Reservoir Simulation.Mastr thesis in Jimma University.a .
- 19.Moriasi N. (2007) Model Evaluation Guidelines for Systematic Quantification of Accuracy in Watershed Simulations. , American Society of Agricultural and Biological Engineers
- 20.NMSA. (2020) National Meteorologic Service Agency,Climatic and Agro climatic Resource of Ethiopia. , Addis Ababa, Ethiopia
- 23.Smith M. (1992) CROPWAT, a computer program for irrigation planningand management. FAO Irrigation and Drainage Paper.